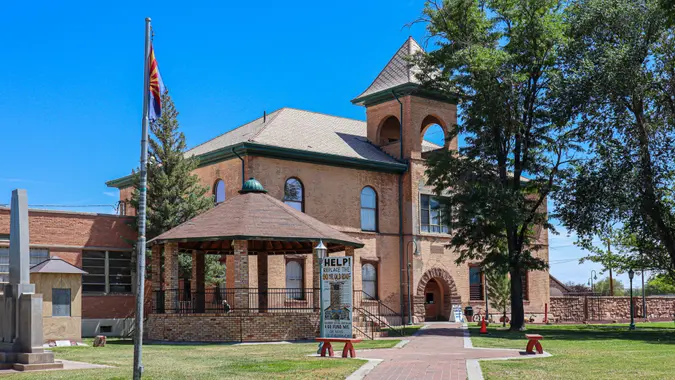
15 Arizona Cities To Live In If You’re Living on Minimum Wage

Commitment to Our Readers
GOBankingRates' editorial team is committed to bringing you unbiased reviews and information. We use data-driven methodologies to evaluate financial products and services - our reviews and ratings are not influenced by advertisers. You can read more about our editorial guidelines and our products and services review methodology.

20 Years
Helping You Live Richer

Reviewed
by Experts

Trusted by
Millions of Readers
Arizona, dubbed The Grand Canyon State, offers breathtaking natural beauty, year-round warm weather and a diverse cultural landscape. In part because of these alluring traits, an increasing number of people are relocating to Arizona.
But Arizona is not a cheap place to live. The cost of living there is 6% higher than the national average, according to RentCafe. Housing is especially expensive — 18% higher than the national average.
The minimum wage in Arizona in 2024 is $14.35 per hour and is expected to increase to $14.70 per hour on Jan. 1, 2025. Though that’s double the national average minimum wage ($7.25 per hour), it doesn’t go far in a pricey state.
If you’re living on minimum wage income, which are the best cities in Arizona to reside in? In a new study, GOBankingRates analyzed cities across the state to find the best places to live if you’re making minimum wage.
15. Holbrook
- Total population: 4,842
- Household median income: $58,856
- Total cost of living annually: $37,381
- Annual cost of living after unadjusted minimum wage income: $7,533*
- Annual cost of living after adjusted minimum wage income: $9,599
14. Huachuca City
- Total population: 1,865
- Household median income: $44,360
- Total cost of living annually: $37,364
- Annual cost of living after unadjusted minimum wage income: $7,516
- Annual cost of living after adjusted minimum wage income: $9,582
13. Elfrida
- Total population: 288
- Household median income: $26,250
- Total cost of living annually: $36,965
- Annual cost of living after unadjusted minimum wage income: $7,117
- Annual cost of living after adjusted minimum wage income: $9,184
12. Salome
- Total population: 708
- Household median income: $79,745
- Total cost of living annually: $36,882
- Annual cost of living after unadjusted minimum wage income: $7,034
- Annual cost of living after adjusted minimum wage income: $9,100
11. Seligman
- Total population: 770
- Household median income: $62,823
- Total cost of living annually: $36,514
- Annual cost of living after unadjusted minimum wage income: $6,666
- Annual cost of living after adjusted minimum wage income: $8,733
10. Willcox
- Total population: 3,232
- Household median income: $40,884
- Total cost of living annually: $36,305
- Annual cost of living after unadjusted minimum wage income: $6,457
- Annual cost of living after adjusted minimum wage income: $8,523
9. Nogales
- Total population: 19,761
- Household median income: $36,682
- Total cost of living annually: $36,034
- Annual cost of living after unadjusted minimum wage income: $6,186
- Annual cost of living after adjusted minimum wage income: $8,252
8. Superior
- Total population: 2,639
- Household median income: $39,600
- Total cost of living annually: $35,821
- Annual cost of living after unadjusted minimum wage income: $5,973
- Annual cost of living after adjusted minimum wage income: $8,039
7. Kearny
- Total population: 2,327
- Household median income: $58,026
- Total cost of living annually: $35,370
- Annual cost of living after unadjusted minimum wage income: $5,522
- Annual cost of living after adjusted minimum wage income: $7,589
6. San Manuel
- Total population: 3,535
- Household median income: $45,625
- Total cost of living annually: $34,896
- Annual cost of living after unadjusted minimum wage income: $5,048
- Annual cost of living after adjusted minimum wage income: $7,114
5. Douglas
- Total population: 3,535
- Household median income: $41,594
- Total cost of living annually: $33,768
- Annual cost of living after unadjusted minimum wage income: $3,920
- Annual cost of living after adjusted minimum wage income: $5,986
4. Dolan Springs
- Total population: 1,397
- Household median income: $36,274
- Total cost of living annually: $32,997
- Annual cost of living after unadjusted minimum wage income: $3,149
- Annual cost of living after adjusted minimum wage income: $5,216
3. Miami
- Total population: 1,353
- Household median income: $30,417
- Total cost of living annually: $32,523
- Annual cost of living after unadjusted minimum wage income: $2,675
- Annual cost of living after adjusted minimum wage income: $4,741
2. Chloride
- Total population: 287
- Household median income: $30,625
- Total cost of living annually: $32,375
- Annual cost of living after unadjusted minimum wage income: $2,527
- Annual cost of living after adjusted minimum wage income: $4,593
1. Ajo
- Total population: 2,922
- Household median income: $46,250
- Total cost of living annually: $31,141
- Annual cost of living after unadjusted minimum wage income: $1,293
- Annual cost of living after adjusted minimum wage income: $3,359
*Note that the cost of living after unadjusted minimum wage income does not take holidays and vacations into account, while the adjusted numbers do.
Methodology: For this study, GOBankingRates analyzed cities across the state of Arizona to find the best places to live if you make minimum wage. The statewide minimum wage was sourced from the Department of Labor. Using a hourly to salary income calculator from calculator.net; assuming 8 holidays per year, 10 vacation days per year, 40 hours per week, and 5 days a week, the annual income can be calculated using the hourly minimum wage. Using the U.S. Census American Community Survey to find all the cities within the state, a number of factors can be found including; ; total population, population ages 65 and over, total households, and household median income all sourced from the US Census American Community Survey. Using this data the percentage of the population ages 65 and over can be calculated. The cost of living indexes were sourced from Sperling’s BestPlaces and include the grocery, healthcare, housing, utilities, transportation, and miscellaneous cost of living indexes. Using the cost of living indexes and the national average expenditure costs, as sourced from the Bureau of Labor Statistics Consumer Expenditure Survey, the average expenditure cost for each location can be calculated. The livability index was sourced from AreaVibes for each location and included as supplemental information. The average single-family home value was sourced from Zillow Home Value Index for September 2024. Using the average single-family home value, assuming a 10% down payment, and using the most recent national average 30-year fixed mortgage rate, as sourced from the Federal Reserve Economic Data, the average mortgage can be calculated. Using the average mortgage and average expenditure costs, the average total monthly and annual cost of living can be calculated. Using the calculated annual income from a minimum wage income and the average total annual cost of living, the annual cost of living after a minimum wage income can be calculated. Using the median household income and the average total annual cost of living, the annual cost of living after a median household income can be calculated. The cities were sorted to show the lowest (cheapest) cost of living after an annual minimum wage income, representing the best places to live for a minimum wage income. All data was collected on and is up to date as of Oct. 28, 2024.
 Written by
  Edited by


