Advertiser Disclosure
GOBankingRates works with many financial advertisers to showcase their products and services to our audiences. These brands compensate us to advertise their products in ads across our site. This compensation may impact how and where products appear on this site. We are not a comparison-tool and these offers do not represent all available deposit, investment, loan or credit products.
Top 50 Real Estate Markets for 2025
 Written by
Travis Woods
 Edited by
Chris Cluff

Commitment to Our Readers
GOBankingRates' editorial team is committed to bringing you unbiased reviews and information. We use data-driven methodologies to evaluate financial products and services - our reviews and ratings are not influenced by advertisers. You can read more about our editorial guidelines and our products and services review methodology.

20 YearsHelping You Live Richer

Reviewed by Experts

Trusted by Millions of Readers
Recently, Realtor.com released its real estate forecast for 2025, predicting that housing availability will be on the upswing in the new year, thanks in part to falling mortgage rates. While they note that home sales on average will increase only by slight degrees, they also reported that some markets in 2025 will see much larger surges in growth (in terms of sales and prices) than the national average.
The booming markets likely will be in the West and South, tied to younger populations in mostly lower-cost markets with flexible work arrangements for residents. Here are the top real estate markets for 2025.
Bakersfield, California
- 2025 existing home sales counts year over year: 9.9%
- 2025 existing home median sales price year over year: 6.0%
- Combined 2025 existing home sales and price growth: 15.9%
Stockton, California
- Also includes: Lodi
- 2025 existing home sales counts year over year: 6.2%
- 2025 existing home median sales price year over year: 9.8%
- Combined 2025 existing home sales and price growth: 16.1%
Oxnard, California
- Also includes: Thousand Oaks, Ventura
- 2025 existing home sales counts year over year: 8.2%
- 2025 existing home median sales price year over year: 8.0%
- Combined 2025 existing home sales and price growth: 16.3%
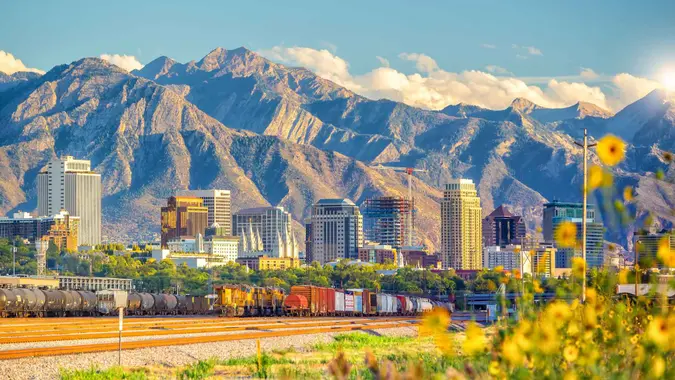
Salt Lake City
- 2025 existing home sales counts year over year: 6.7%
- 2025 existing home median sales price year over year: 10.0%
- Combined 2025 existing home sales and price growth: 16.7%
Dallas
- Also includes: Fort Worth, Arlington
- 2025 existing home sales counts year over year: 7.6%
- 2025 existing home median sales price year over year: 9.2%
- Combined 2025 existing home sales and price growth: 16.7%
St. Louis
- 2025 existing home sales counts year over year: 9.7%
- 2025 existing home median sales price year over year: 7.1%
- Combined 2025 existing home sales and price growth: 16.8%
Chicago
- Also includes: Naperville, Elgin
- 2025 existing home sales counts year over year: 12.4%
- 2025 existing home median sales price year over year: 4.5%
- Combined 2025 existing home sales and price growth: 16.8%
New York City
- Also includes: Newark, Jersey City
- 2025 existing home sales counts year over year: 11.0%
- 2025 existing home median sales price year over year: 5.9%
- Combined 2025 existing home sales and price growth: 16.9%
Winston-Salem, North Carolina
- 2025 existing home sales counts year over year: 7.7%
- 2025 existing home median sales price year over year: 9.2%
- Combined 2025 existing home sales and price growth: 16.9%
Albany, New York
- Also includes: Schenectady, Troy
- 2025 existing home sales counts year over year: 10.3%
- 2025 existing home median sales price year over year: 6.6%
- Combined 2025 existing home sales and price growth: 17.0%
Scranton, Pennsylvania
- Also includes: Wilkes-Barre, Hazelton
- 2025 existing home sales counts year over year: 11.6%
- 2025 existing home median sales price year over year: 5.7%
- Combined 2025 existing home sales and price growth: 17.4%
Toledo, Ohio
- 2025 existing home sales counts year over year: 10.8%
- 2025 existing home median sales price year over year: 6.7%
- Combined 2025 existing home sales and price growth: 17.5%
Las Vegas
- Also includes: Henderson, Paradise
- 2025 existing home sales counts year over year: 5.5%
- 2025 existing home median sales price year over year: 12.3%
- Combined 2025 existing home sales and price growth: 17.8%
Portland, Oregon
- Also includes: Vancouver, Hillsboro
- 2025 existing home sales counts year over year: 11.1%
- 2025 existing home median sales price year over year: 6.7%
- Combined 2025 existing home sales and price growth: 17.8%
Springfield, Massachusetts
- 2025 existing home sales counts year over year: 11.0%
- 2025 existing home median sales price year over year: 6.8%
- Combined 2025 existing home sales and price growth: 17.8%
Buffalo, New York
- Also includes: Cheektowaga, Niagra Falls
- 2025 existing home sales counts year over year: 9.7%
- 2025 existing home median sales price year over year: 8.5%
- Combined 2025 existing home sales and price growth: 18.2%
Philadelphia
- Also includes: Camden, Wilmington
- 2025 existing home sales counts year over year: 12.3%
- 2025 existing home median sales price year over year: 6.1%
- Combined 2025 existing home sales and price growth: 18.3%
Deltona, Florida
- Also includes: Dayonta Beach, Ormond Beach
- 2025 existing home sales counts year over year: 7.2%
- 2025 existing home median sales price year over year: 11.5%
- Combined 2025 existing home sales and price growth: 18.7%
Memphis, Tennessee
- 2025 existing home sales counts year over year: 8.3%
- 2025 existing home median sales price year over year: 10.5%
- Combined 2025 existing home sales and price growth: 18.8%
Baltimore
- Also includes: Columbia, Towson
- 2025 existing home sales counts year over year: 16.2%
- 2025 existing home median sales price year over year: 2.7%
- Combined 2025 existing home sales and price growth: 18.9%
Seattle
- Also includes: Tacoma, Bellevue
- 2025 existing home sales counts year over year: 12.2%
- 2025 existing home median sales price year over year: 6.9%
- Combined 2025 existing home sales and price growth: 19.0%
Akron, Ohio
- 2025 existing home sales counts year over year: 15.0%
- 2025 existing home median sales price year over year: 4.2%
- Combined 2025 existing home sales and price growth: 19.2%
San Antonio
- Also includes: New Braunfels
- 2025 existing home sales counts year over year: 10.9%
- 2025 existing home median sales price year over year: 9.1%
- Combined 2025 existing home sales and price growth: 20.0%
Augusta, Georgia
- Also includes: Richmond County
- 2025 existing home sales counts year over year: 14.2%
- 2025 existing home median sales price year over year: 5.8%
- Combined 2025 existing home sales and price growth: 20.0%
Honolulu
- 2025 existing home sales counts year over year: 13.4%
- 2025 existing home median sales price year over year: 6.7%
- Combined 2025 existing home sales and price growth: 20.1%
Riverside, California
- Also includes: San Bernardino, Ontario
- 2025 existing home sales counts year over year: 11.4%
- 2025 existing home median sales price year over year: 8.8%
- Combined 2025 existing home sales and price growth: 20.2%
Columbia, South Carolina
- 2025 existing home sales counts year over year: 12.1%
- 2025 existing home median sales price year over year: 8.2%
- Combined 2025 existing home sales and price growth: 20.3%
Allentown, Pennsylvania
- Also includes: Bethlehem, Easton
- 2025 existing home sales counts year over year: 12.3%
- 2025 existing home median sales price year over year: 8.0%
- Combined 2025 existing home sales and price growth: 20.4%
Tampa, Florida
- Also includes: St. Petersburg, Clearwater
- 2025 existing home sales counts year over year: 9.1%
- 2025 existing home median sales price year over year: 11.8%
- Combined 2025 existing home sales and price growth: 20.9%
Lakeland, Florida
- Also includes: Winter Haven
- 2025 existing home sales counts year over year: 10.6%
- 2025 existing home median sales price year over year: 10.3%
- Combined 2025 existing home sales and price growth: 20.9%
Denver
- Also includes: Aurora, Lakewood
- 2025 existing home sales counts year over year: 13.6%
- 2025 existing home median sales price year over year: 8.0%
- Combined 2025 existing home sales and price growth: 21.6%
Harrisburg, Pennsylvania
- Also includes: Carlisle
- 2025 existing home sales counts year over year: 16.8%
- 2025 existing home median sales price year over year: 5.1%
- Combined 2025 existing home sales and price growth: 21.9%
Washington, D.C.
- Also includes: Arlington, Alexandria
- 2025 existing home sales counts year over year: 17.0%
- 2025 existing home median sales price year over year: 5.0%
- Combined 2025 existing home sales and price growth: 22.0%
Cape Coral, Florida
- Also includes: Fort Myers
- 2025 existing home sales counts year over year: 13.2%
- 2025 existing home median sales price year over year: 9.6%
- Combined 2025 existing home sales and price growth: 22.8%
Jacksonville, Florida
- 2025 existing home sales counts year over year: 13.5%
- 2025 existing home median sales price year over year: 9.8%
- Combined 2025 existing home sales and price growth: 23.3%
Little Rock, Arkansas
- Also includes: North Little Rock, Conway
- 2025 existing home sales counts year over year: 18.6%
- 2025 existing home median sales price year over year: 4.8%
- Combined 2025 existing home sales and price growth: 23.4%
Charlotte, North Carolina
- Also includes: Concord, Gastonia
- 2025 existing home sales counts year over year: 15.7%
- 2025 existing home median sales price year over year: 8.4%
- Combined 2025 existing home sales and price growth: 24.1%
Durham, North Carolina
- Also includes: Chapel Hill
- 2025 existing home sales counts year over year: 14.1%
- 2025 existing home median sales price year over year: 10.1%
- Combined 2025 existing home sales and price growth: 24.2%
Austin, Texas
- Also includes: Round Rock
- 2025 existing home sales counts year over year: 14.5%
- 2025 existing home median sales price year over year: 10.2%
- Combined 2025 existing home sales and price growth: 24.7%
Tucson, Arizona
- 2025 existing home sales counts year over year: 12.5%
- 2025 existing home median sales price year over year: 12.4%
- Combined 2025 existing home sales and price growth: 24.8%
Greensboro, North Carolina
- Also includes: High Point
- 2025 existing home sales counts year over year: 17.3%
- 2025 existing home median sales price year over year: 7.7%
- Combined 2025 existing home sales and price growth: 25.0%
Atlanta
- Also includes: Sandy Springs, Roswell
- 2025 existing home sales counts year over year: 15.1%
- 2025 existing home median sales price year over year: 10.2%
- Combined 2025 existing home sales and price growth: 25.3%
Phoenix
- Also includes: Mesa, Scottsdale
- 2025 existing home sales counts year over year: 12.2%
- 2025 existing home median sales price year over year: 13.2%
- Combined 2025 existing home sales and price growth: 25.5%
McAllen, Texas
- Also includes: Edinburg, Mission
- 2025 existing home sales counts year over year: 19.8%
- 2025 existing home median sales price year over year: 7.0%
- Combined 2025 existing home sales and price growth: 26.8%
Orlando, Florida
- Also includes: Kissimmee, Sanford
- 2025 existing home sales counts year over year: 15.2%
- 2025 existing home median sales price year over year: 12.1%
- Combined 2025 existing home sales and price growth: 27.3%
Richmond, Virginia
- 2025 existing home sales counts year over year: 21.6%
- 2025 existing home median sales price year over year: 6.1%
- Combined 2025 existing home sales and price growth: 27.6%
El Paso, Texas
- 2025 existing home sales counts year over year: 19.3%
- 2025 existing home median sales price year over year: 8.4%
- Combined 2025 existing home sales and price growth: 27.8%
Find Out: 5 Cities Retirees AreMoving To in 2025
Virginia Beach, Virginia
- Also includes: Norfolk, Newport News
- 2025 existing home sales counts year over year: 23.4%
- 2025 existing home median sales price year over year: 6.6%
- Combined 2025 existing home sales and price growth: 29.9%
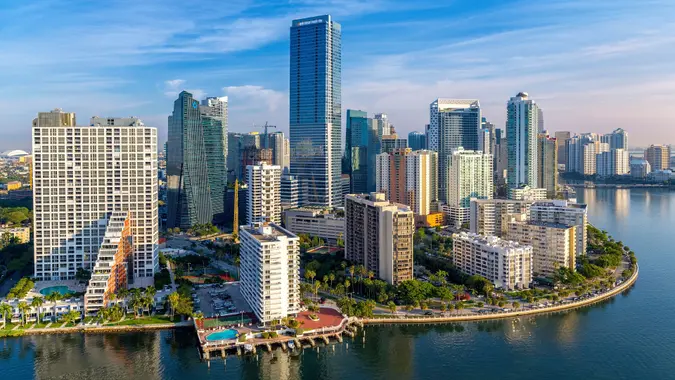
Miami
- Also includes: Fort Lauderdale, West Palm Beach
- 2025 existing home sales counts year over year: 24.0%
- 2025 existing home median sales price year over year: 9.0%
- Combined 2025 existing home sales and price growth: 33.0%
Colorado Springs, Colorado
- 2025 existing home sales counts year over year: 27.1%
- 2025 existing home median sales price year over year: 12.7%
- Combined 2025 existing home sales and price growth: 39.8%
Share This Article:


You May Also Like


3 Worst Florida Suburbs To Buy Property in the Next 5 Years, According to Real Estate Agents
February 03, 2026
9 min Read

5 Florida Beach Towns To Buy Property in the Next 5 Years, According to Real Estate Agents
February 02, 2026
9 min Read


Dave Ramsey Says the 50-Year Mortgage Was a 'Bogus Political Stunt' -- Here's Why
January 30, 2026
9 min Read


8 Metros in Western States Where Home Prices Are Dropping -- and What That Means for Buyers
January 30, 2026
9 min Read

5 Home Elements Retiree Buyers Almost Always Regret, According to Real Estate Agents
January 28, 2026
9 min Read

5 Home Features That Are Overrated for Retirees, According to Real Estate Experts
January 28, 2026
9 min Read


7 Southern Cities Where Home Prices Are Expected To Crash in the Next 12 Months
January 27, 2026
9 min Read


Cheapest Places To Buy a House in 2026 -- You May Be Surprised by the List
January 26, 2026
9 min Read
Make your money work for you
Get the latest news on investing, money, and more with our free newsletter.
By subscribing, you agree to our Terms of Use and Privacy Policy. Unsubscribe at any time.


Thanks!
You're now subscribed to our newsletter.
Check your inbox for more details.


Sending you timely financial stories that you can bank on.
Sign up for our daily newsletter for the latest financial news and trending topics.
For our full Privacy Policy, click here.
Looks like you're using an adblocker
Please disable your adblocker to enjoy the optimal web experience and access the quality content you appreciate from GOBankingRates.
- AdBlock / uBlock / Brave
- Click the ad blocker extension icon to the right of the address bar
- Disable on this site
- Refresh the page
- Firefox / Edge / DuckDuckGo
- Click on the icon to the left of the address bar
- Disable Tracking Protection
- Refresh the page
- Ghostery
- Click the blue ghost icon to the right of the address bar
- Disable Ad-Blocking, Anti-Tracking, and Never-Consent
- Refresh the page


