Study Finds the 25 Worst States to Make a Profit on Your Home
 Written by
Gabrielle Olya
Written by
Gabrielle Olya

Commitment to Our Readers
GOBankingRates' editorial team is committed to bringing you unbiased reviews and information. We use data-driven methodologies to evaluate financial products and services - our reviews and ratings are not influenced by advertisers. You can read more about our editorial guidelines and our products and services review methodology.
20 Years
Helping You Live Richer
Reviewed
by Experts
Trusted by
Millions of Readers
The median national home value has increased 5.91 percent over the past five years, and is currently at $207,600.
However, home values and the rates they are increasing — or in some cases, decreasing — vary greatly from state to state, a new GOBankingRates study found.
To determine the states where real estate values are increasing the most and least, GOBankingRates analyzed all 50 states plus Washington, D.C. and scored them in terms of changes in median home values month-over-month, quarter-over-quarter, year-over-year and over the past five years. The year-over-year and five-year changes were weighted more heavily, since the other two measures tend to be more volatile.
Knowing which states have the largest increases in home values is important information for perspective homebuyers, especially those hoping to make the largest return on investment possible. States with home values that have remained stagnant or have been decreasing might not be not good places to buy homes for people looking to buy an investment property, or even people who hope to resell at some point down the line.
The five states where home values are increasing the most include Nevada, Delaware, Washington, California and Colorado.
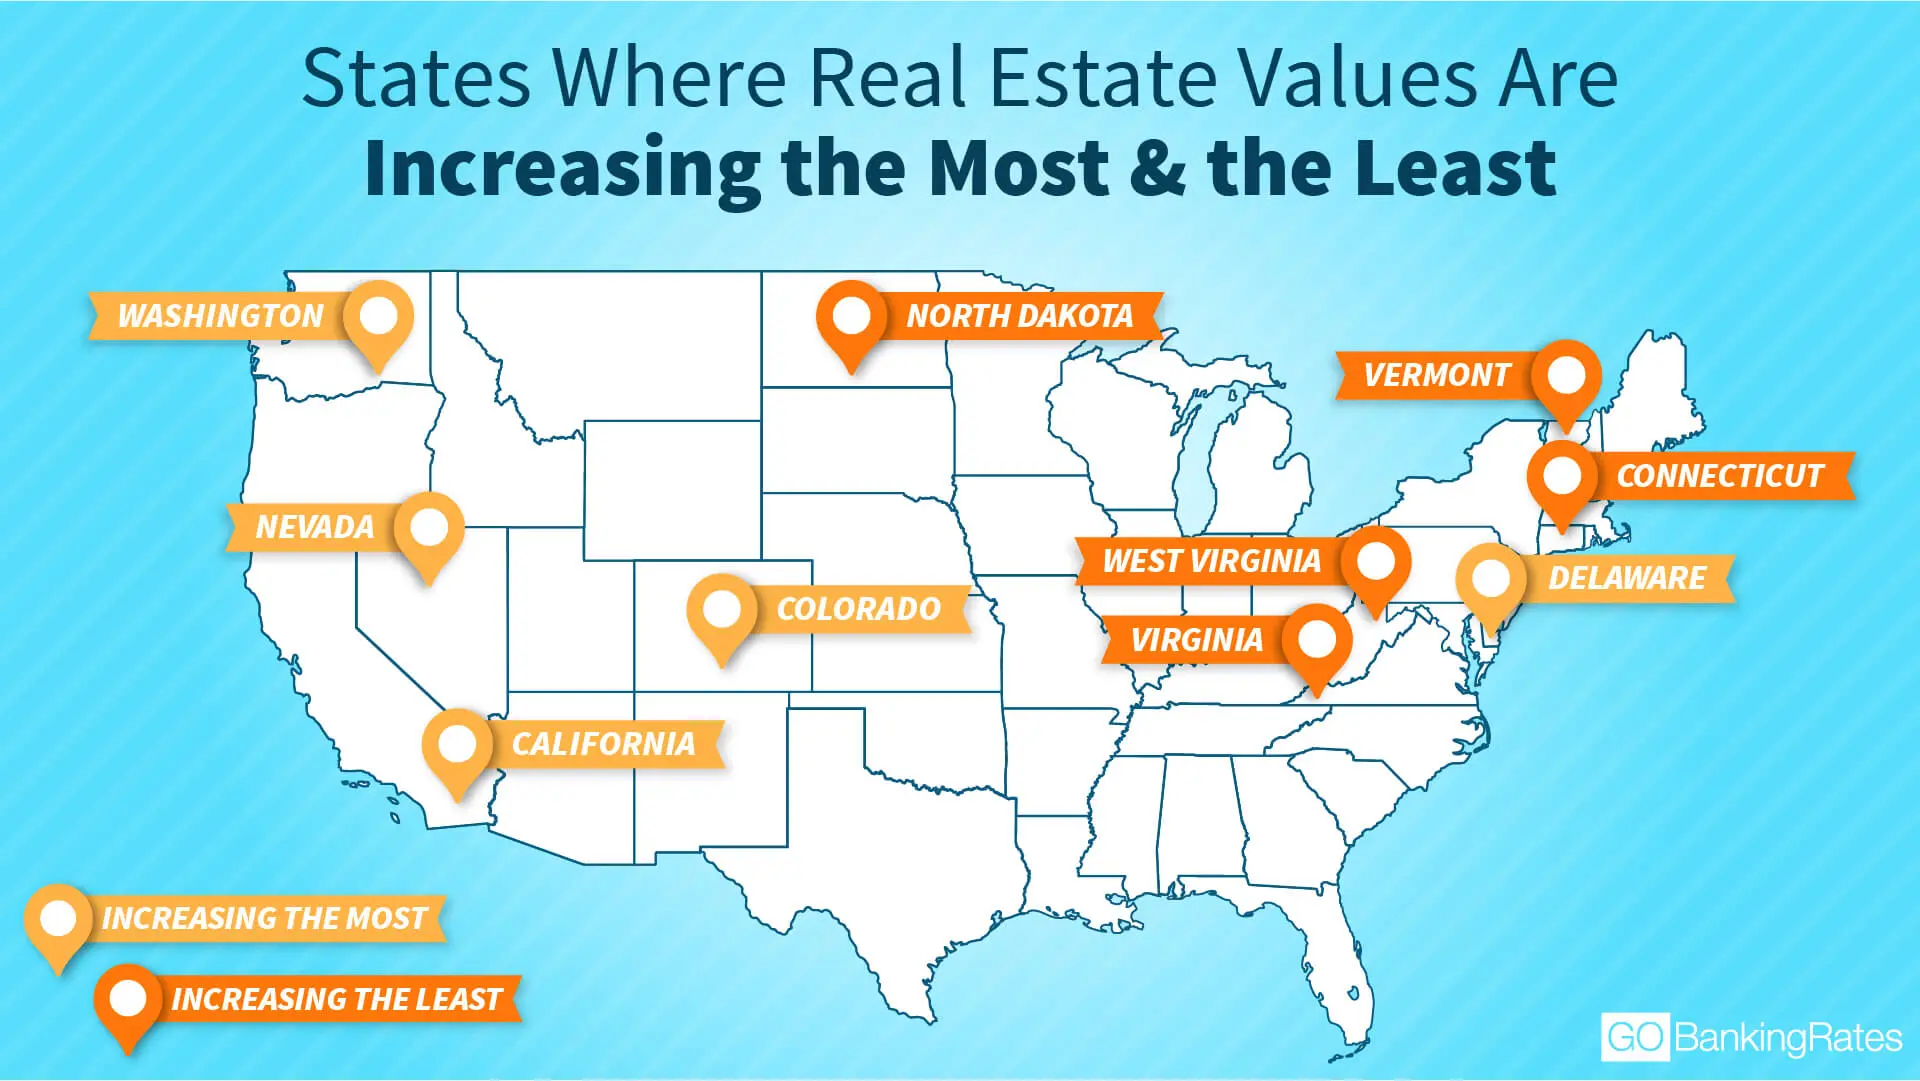
Some of the states where home values aren’t increasing as much are those known to have older homes, including Connecticut and Kansas, where the majority of the homes were built in the 1950s, according to Zillow. In some states, such as New Jersey, values are increasing so slowly that they have not yet reached pre-Great Recession levels.
Meanwhile, the states where home values are increasing the most tend to be places that have seen heavy migration in recent years, such was Washington and Oregon, where people moved to find affordable homes and/or to find jobs, especially in tech.
Here is the complete ranking of states where home values are increasing the most:
| Rank | State | Median Home Value | Month-over-month Change | Quarter-over-quarter change | Year-over-year change | 5-year change |
| 1 | Nevada | $261,000 | 0.54% | 2.35% | 12.94% | 13.09% |
| 2 | Delaware | $245,900 | 2.33% | 8.33% | 14.48% | 5.63% |
| 3 | Washington | $355,600 | 0.77% | 2.27% | 10.99% | 9.29% |
| 4 | California | $529,900 | 0.65% | 2.28% | 8.76% | 9.74% |
| 5 | Colorado | $348,400 | 0.64% | 1.87% | 7.80% | 9.70% |
| 6 | Oregon | $320,500 | 0.47% | 1.46% | 7.19% | 9.92% |
| 7 | Utah | $264,100 | 0.76% | 2.88% | 9.04% | 7.66% |
| 8 | Florida | $217,300 | 0.37% | 1.35% | 7.15% | 9.97% |
| 9 | Michigan | $138,700 | 0.65% | 1.84% | 6.69% | 8.02% |
| 10 | Arizona | $233,400 | 0.43% | 1.35% | 6.72% | 8.09% |
| 11 | Idaho | $200,300 | 0.35% | -0.35% | 9.27% | 6.70% |
| 12 | Texas | $175,200 | 0.52% | 1.92% | 7.62% | 7.09% |
| 13 | Maine | $219,700 | 1.15% | 3.98% | 9.85% | 3.85% |
| 14 | New York | $309,100 | 0.32% | 0.98% | 10.27% | 4.90% |
| 15 | Rhode Island | $268,000 | 0.87% | 2.45% | 8.50% | 5.17% |
| 16 | Hawaii | $624,200 | 0.39% | 1.69% | 6.68% | 7.09% |
| 17 | Montana | $212,200 | 1.29% | 3.71% | 7.17% | 4.29% |
| 18 | Georgia | $162,100 | 0.43% | 1.19% | 6.23% | 6.79% |
| 19 | South Dakota | $180,900 | 0.89% | 2.61% | 7.55% | 4.70% |
| 20 | Nebraska | $157,200 | 0.38% | 1.62% | 7.75% | 4.88% |
| 21 | Mississippi | $120,400 | 1.52% | 5.24% | 7.89% | 2.29% |
| 22 | Tennessee | $147,100 | 0.27% | 1.24% | 7.45% | 5.01% |
| 23 | Massachusetts | $386,500 | 0.26% | 0.94% | 5.80% | 5.95% |
| 24 | Minnesota | $213,200 | 0.42% | 0.85% | 5.02% | 6.19% |
| 25 | New Hampshire | $253,600 | 0.28% | 1.24% | 6.29% | 5.01% |
Here is the complete ranking of states where home values are increasing the least:
| Rank | State | Median Home Value | Month-over-month change | Quarter-over-quarter change | Year-over-year change | 5-year change |
| 1 | North Dakota | $201,500 | 0.15% | 0.10% | -0.79% | 2.81% |
| 2 | Connecticut | $246,800 | 0.28% | 0.37% | 1.94% | 1.21% |
| 3 | Vermont | $223,100 | -0.18% | -1.37% | 2.43% | 2.03% |
| 4 | Virginia | $246,300 | 0.00% | -0.08% | 2.28% | 2.88% |
| 5 | West Virginia | $104,100 | 0.19% | 0.87% | 2.06% | 2.84% |
| 6 | Alaska | $273,700 | 0.40% | 1.11% | 2.59% | 2.24% |
| 7 | Alabama | $128,000 | 0.31% | 1.19% | 3.39% | 2.06% |
| 8 | Maryland | $273,500 | 0.22% | 0.40% | 2.01% | 3.55% |
| 9 | Oklahoma | $117,000 | -0.09% | 0.26% | 1.92% | 4.34% |
| 10 | Kansas | $128,400 | 0.16% | 0.94% | 3.63% | 3.03% |
| 11 | Pennsylvania | $163,400 | 0.25% | 0.99% | 4.14% | 2.57% |
| 12 | Illinois | $170,700 | 0.29% | 0.53% | 2.52% | 3.96% |
| 13 | New Jersey | $312,400 | 0.32% | 0.81% | 3.96% | 3.33% |
| 14 | Kentucky | $138,700 | 0.14% | 1.02% | 4.36% | 3.34% |
| 15 | Iowa | $131,600 | 0.53% | 1.86% | 3.87% | 3.02% |
| 16 | Indiana | $126,000 | 0.48% | 2.19% | 5.26% | 2.73% |
| 17 | Missouri | $145,500 | 0.76% | 2.03% | 4.15% | 3.54% |
| 18 | Arkansas | $123,000 | 0.24% | 1.15% | 6.03% | 3.06% |
| 19 | Ohio | $131,000 | 0.38% | 0.92% | 4.88% | 4.03% |
| 20 | Wyoming | $202,600 | 1.10% | 3.16% | 4.70% | 2.65% |
| 21 | Wisconsin | $170,100 | 0.35% | 0.83% | 5.39% | 3.78% |
| 22 | District of Columbia | $548,600 | 0.37% | 1.14% | 1.27% | 7.06% |
| 23 | South Carolina | $149,300 | 0.74% | 1.63% | 4.99% | 4.22% |
| 24 | North Carolina | $166,900 | 0.36% | 1.40% | 6.58% | 4.12% |
| 25 | New Mexico | $182,300 | 1.11% | 4.59% | 6.24% | 2.97% |
Click through to read more about the best and worst cities to own investment property.
Methodology: GOBankingRates analyzed all 50 U.S. states plus Washington, D.C., and scored in terms of four factors: (1) Month-over-month change in Zillow median home value, weighted half because this tends to be more volatile than longer intervals; (2) Quarter-over-quarter change in Zillow median home value, weighted half because this tends to be more volatile than longer intervals; (3) Year-over-year change in Zillow median home value, weighted double; (4) Five-year change in Zillow median home value, weighted double. Median home value data represent all homes as of January 2018, the most updated data available.


