These 19 Metro Areas Have the Biggest Wealth Gaps, Study Finds
 Written by
Jennifer Taylor
Written by
Jennifer Taylor
 Edited by
Cooper Bernier
Edited by
Cooper Bernier

Commitment to Our Readers
GOBankingRates' editorial team is committed to bringing you unbiased reviews and information. We use data-driven methodologies to evaluate financial products and services - our reviews and ratings are not influenced by advertisers. You can read more about our editorial guidelines and our products and services review methodology.
20 Years
Helping You Live Richer
Reviewed
by Experts
Trusted by
Millions of Readers
Income creates a disparity in every U.S. city, but the gap is significantly larger in some areas than in others. And a study recently completed by GOBankingRates highlighted 19 cities where the distribution of wealth is striking.
Despite the cities’ geographic proximity to one another, the extreme levels of affluence and poverty in these cities mean residents in each group essentially are living in different worlds.
To identify the U.S. cities most divided by wealth, GOBankingRates analyzed the 100 largest metro areas in the country based on four factors: average income of the top 1 percent, average income of the bottom 99 percent, median household income of the wealthiest city in the metro area and median household income of the poorest city in the metro area. Cities were then scored and ranked in order of inequality.
No two cities have the exact same income discrepancy, but the overarching problem is evident in each one — a shrinking middle class. Extremes on both ends of the wealth spectrum mean fewer people fit into what traditionally is considered the largest economic class in the country.
Interestingly, four of the top five metropolitan areas on the list are in Florida. In total, “The Sunshine State” is ranked six times, indicating a major divide between the rich and poor throughout the state.
Surprisingly, the New York City metro region didn’t make the list despite being long-considered one of the most expensive areas to live in the country. However, two regions located within a couple of hours of the area did make the cut.
Here are the 19 cities that displayed the biggest income gaps in the study:
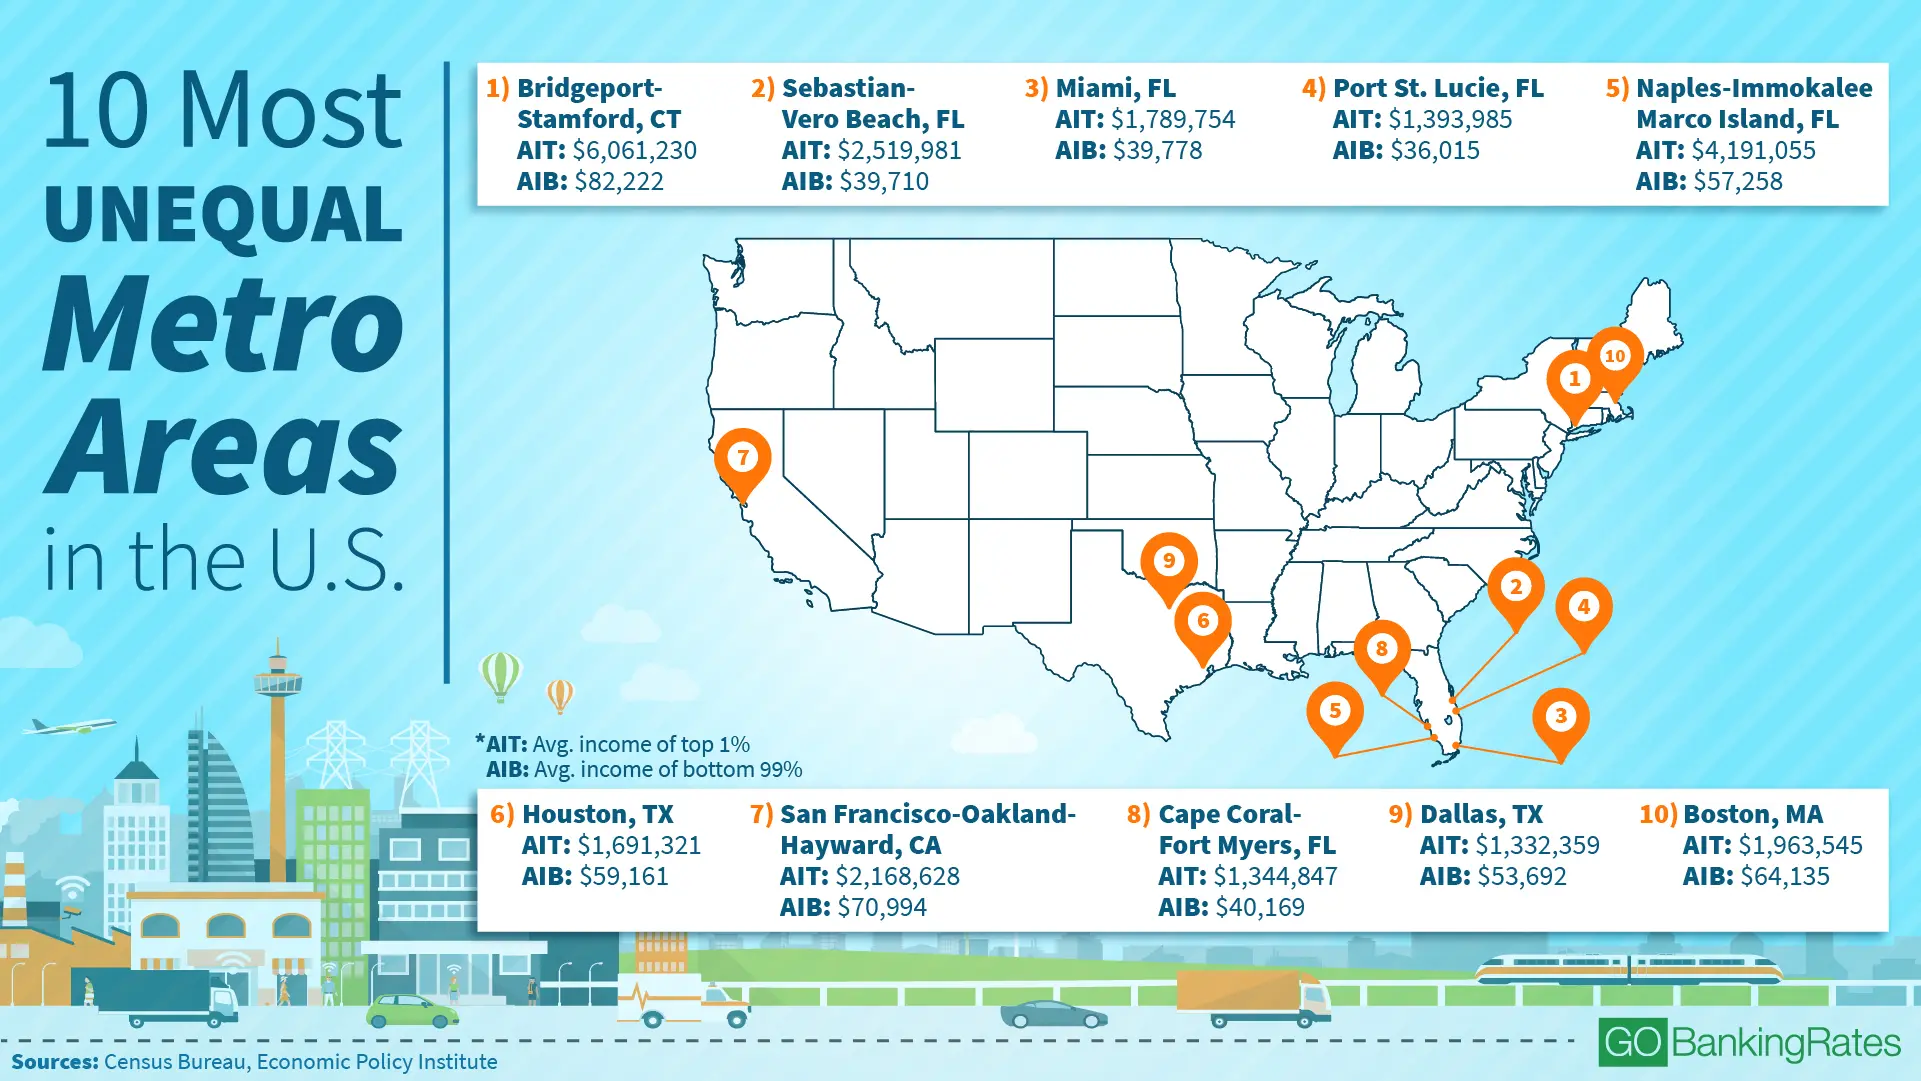
| Rank | Metro/City | Average Income of Top 1% | Average Income of Bottom 99% | Top-to-Bottom Ratio | Median Income – Top Neighborhood | Median Income – Bottom Neighborhood |
| 1 | Bridgeport-Stamford, Conn. | $6,061,230 | $82,222 | 73.7 | $205,688 | $41,050 |
| 2 | Sebastian-Vero Beach, Fla. | $2,519,981 | $39,710 | 63.5 | $217,375 | $27,239 |
| 3 | Miami | $1,789,754 | $39,778 | 45 | $250,000 | $20,338 |
| 4 | Port St. Lucie, Fla. | $1,393,985 | $36,015 | 38.7 | $250,000 | $23,125 |
| 5 | Naples-Immokalee-Marco Island, Fla. | $4,191,055 | $57,258 | 73.2 | $102,997 | $11,386 |
| 6 | Houston | $1,691,321 | $59,161 | 28.6 | $250,000 | $12,500 |
| 7 | San Francisco-Oakland-Hayward, Calif. | $2,168,628 | $70,994 | 30.5 | $239,886 | $35,288 |
| 8 | Cape Coral-Fort Myers, Fla. | $1,344,847 | $40,169 | 33.5 | $172,981 | $17,941 |
| 9 | Dallas | $1,332,359 | $53,692 | 24.8 | $194,517 | $20,644 |
| 10 | Boston | $1,963,545 | $64,135 | 30.6 | $168,690 | $32,851 |
| 11 | Reno, Nev. | $1,332,600 | $39,726 | 33.5 | $143,804 | $24,722 |
| 12 | Trenton, N.J. | $1,632,830 | $60,245 | 27.1 | $147,778 | $14,145 |
| 13 | Las Vegas | $1,459,955 | $35,895 | 40.7 | $91,851 | $25,938 |
| 14 | Santa Fe, N.M. | $1,410,235 | $46,590 | 30.3 | $102,614 | $9,516 |
| 15 | North Port-Sarasota-Bradenton, Fla. | $1,353,983 | $38,921 | 34.8 | $92,560 | $23,368 |
| 16 | Los Angeles-Long Beach-Anaheim, Calif. | $1,455,805 | $48,492 | 30 | $113,646 | $29,146 |
| 17 | Fayetteville-Springdale-Rogers, Ark. | $1,594,106 | $48,151 | 33.1 | $81,607 | $23,375 |
| 18 | Atlanta | $1,025,362 | $48,356 | 21.2 | $108,464 | $17,118 |
| 19 | New Orleans | $961,042 | $44,025 | 21.8 | $105,710 | $16,604 |
Keep reading to discover the secret wealth behind these big cities.
Methodology: To identify the U.S. areas most divided by wealth, GOBankingRates analyzed the 100 largest metro areas in the country according to four factors: (1) average income of the top 1 percent; (2) average income of the bottom 99 percent, sourced from the Economic Policy Institute; (3) median household income of the wealthiest city in the metro area; and (4) median household income of the poorest city in the metro area, sourced from the U.S. Census Bureau. Metro areas were scored and ranked based on the four factors.


