Guess the Amount Americans Spend on These 5 Common Things
 Written by
Jodi Thornton-O'Connell
Written by
Jodi Thornton-O'Connell

Commitment to Our Readers
GOBankingRates' editorial team is committed to bringing you unbiased reviews and information. We use data-driven methodologies to evaluate financial products and services - our reviews and ratings are not influenced by advertisers. You can read more about our editorial guidelines and our products and services review methodology.
20 Years
Helping You Live Richer
Reviewed
by Experts
Trusted by
Millions of Readers

Making a monthly budget is the key to financial well-being, but have you ever wondered how your monthly spending compares to other people's expenditures?
GOBankingRates conducted five surveys to find out how Americans spend their money. Consumers were asked the following questions:
- How much money do you spend on your monthly mortgage or rent payment?
- How much money do you spend on your monthly car payment (lease or finance)?
- About how much money do you spend each month on groceries?
- About how much money do you spend on household necessities each month (toilet paper, paper towels, toothpaste, etc.)?
- About how much money do you spend each month on clothing and clothing accessories?
The survey results showed that not only do men and women spend differently, but so do individuals living in different parts of the country. Check out how your monthly spending compares to how other Americans spend their money.

Here’s How Much Americans Spend on Their Basic Needs
So how much do Americans spend each month? Here's what the respondents said they spend on average for each item:
- Mortgage or rent: $682
- Groceries: $302
- Car payment: $166
- Household necessities: $61
- Clothing: $50
- Total monthly spending: $1,261
Although men and women's spending varied by category, they both have similar monthly totals when everything is added up. Men spend slightly more at $1,296 than women at $1,257.
Mid-career respondents (ages 35 to 54) spend the most each month, averaging about $1,510 per month for all items. People age 65 and older have the smallest monthly expenditures at $829 per month.
Additionally, people making under $25,000 per year have the smallest outlay for these expenses at $1,092 per month (or $13,104 a year). While that figure doesn't seem like much, it totals 54.6 percent of the yearly income of someone making $24,000 annually. And keep in mind this figure doesn't include eating out, utilities, child care, gas or other essentials — so you can imagine there's not much room in the budget to splurge on guilty pleasures.
By comparison, a person making $49,000 per year spends just around 28.5 percent of their income on the expenses included in the survey, and someone making $150,000 a year averages 13.2 percent.
Although you might imagine that people making $150,000 or more annually would spend the most on monthly expenses, that wasn't the case. They average $1,654 per month in expenses. People earning $100,000 to $149,000 have the highest monthly expenses at $1,941. The difference could equate to more cash flow for the highest-earning group, which means they might be able to afford higher down payments on houses and cars to reduce monthly payment amounts.
Although the Northeastern states have a reputation for being expensive, people out West actually pay the most per month with expenses totaling $1,422. The Northeastern respondents pay only $1,304 monthly for the same expenses. Midwesterners have the cheapest monthly nut to crack at $1,146.
Check Out: You'll Need This Much Money to Live Comfortably in the 50 Biggest Cities in America
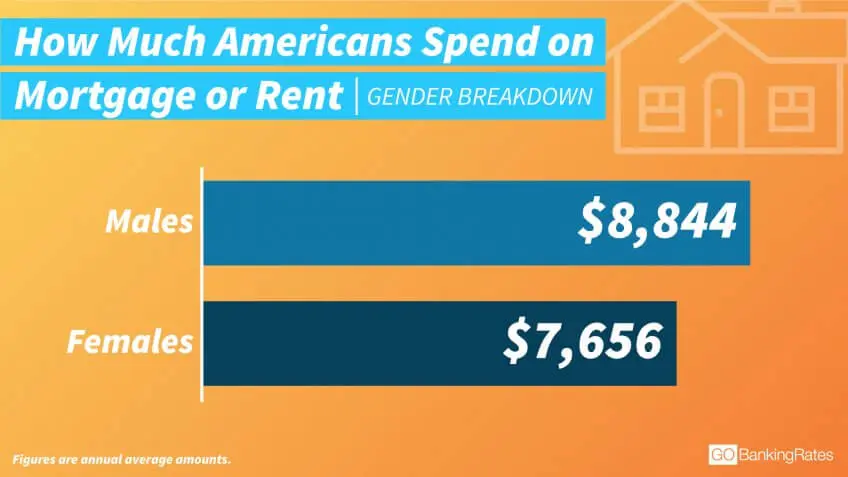
Women’s Low Spending on Housing Could Reflect ‘Housing Gender Gap’
When it comes to housing, women pay $99 less per month on average than men. Women earn about 20 percent less than men, on average, so it makes sense they'd need to pinch pennies when it comes time to buy a home or rent an apartment.
Not only that, but mortgage lenders typically recommend that no more than 30 percent of your monthly budget should go toward your mortgage or rent, meaning some women might not qualify for as much house as their well-paid male counterparts. For example, Houston, Chicago and Seattle are some of the most unaffordable cities for single female homebuyers — but not single men homebuyers, according to statistics compiled by PropertyShark and RENTCafé.
The gender gap extends beyond the monthly housing budget, however. A 2016 study by RealtyTrac showed that homes owned by single men appraise for an average of 10 percent higher than homes owned by single women. Also, "homes owned by single men have gained an average of $63,921 since purchase, which equates to a 33 percent return on purchase price. That is $10,112 — or 16 percent — higher than average gains single women have seen from their home purchase," according to the study.
Learn More: 6 Reasons Why Women Are Struggling to Buy a Home
But a higher salary doesn't always equate to higher housing expenditures. The GOBankingRates survey found that respondents making more than $150,000 annually spend $316 per month less on their rent or mortgage than those who make between $100,000 and $149,000 yearly.
Does that mean the ultra rich are living below their means? Not necessarily. Access to greater financial resources can give wealthier homebuyers more options to keep their monthly housing payments low. Such strategies might include putting more money down or using proceeds from the sale of a previous home to keep the monthly mortgage lower.
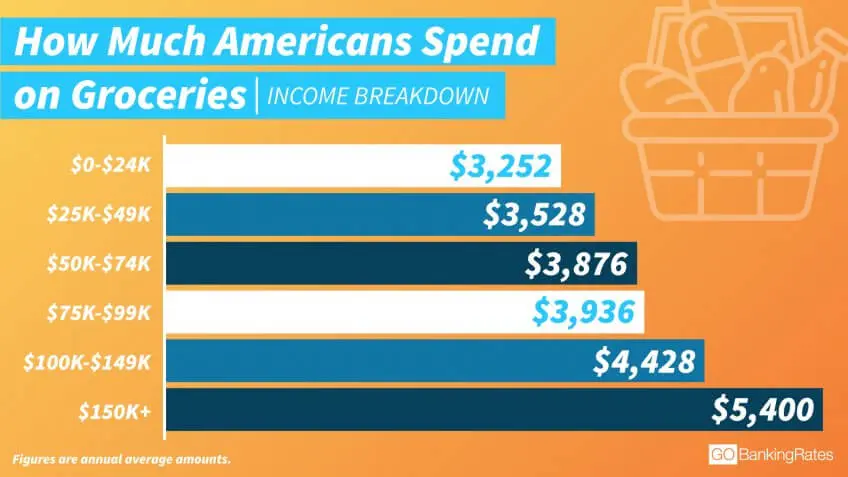
The More You Earn, the More You Spend on Groceries
Not surprisingly, the GOBankingRates survey showed that respondents who earn more money have a higher monthly grocery bill.
Although the highest income group shells out $450 per month in groceries, it's the low-wage earners who spend a greater percentage of their income on food. People making $24,000 per year average $271 per month on groceries, or 13.55 percent of their income. The percentage of income spent on groceries steadily decreases as incomes increase, leveling off and increasing slightly when earners reached $150,000 annual income.
If you spend more than these annual amounts, explore the dozens of ways you can save hundreds on groceries:
|
Annual Income |
Annual Grocery Budget |
Percentage of Income |
|
$24,000 |
$3,252 |
13.55% |
|
$49,000 |
$3,528 |
7.2% |
|
$74,000 |
$3,876 |
5.2% |
|
$99,000 |
$3,936 |
3.97% |
|
$125,000 |
$4,428 |
3.54% |
|
$150,000 |
$5,400 |
3.6% |
That stereotype about Southerners loving to wrap their lips around a good morsel might not be far off. The GOBankingRates survey also revealed Southerners spend slightly more on groceries — $308 versus the $290 Northeast residents spend each month.
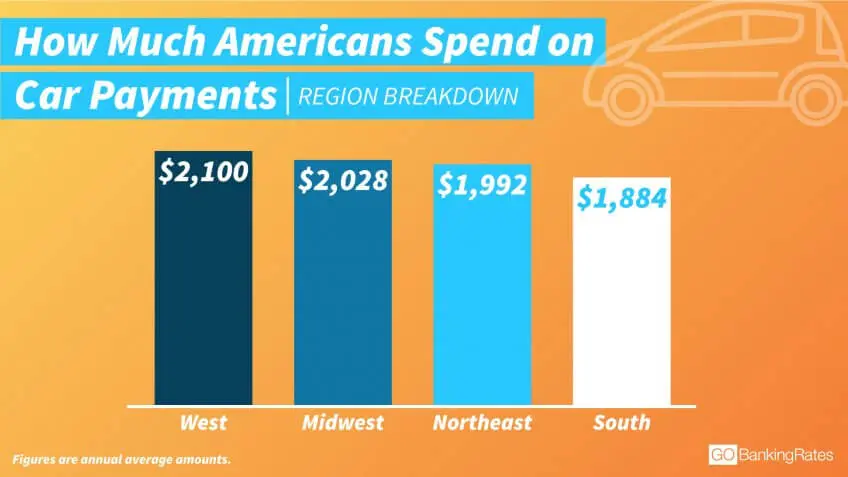
Residents in Western States Spend More on Their Car Payments
All of the finance-savvy survey respondents claim to pay far less than the national average car payment, which is $506 for a new loan, according to Experian data. Southerners save the most money per month on car payments, shelling out just $157 per month. Westerners pay the most at $175.
Why the discrepancy among regions? One explanation could be because used car prices are higher in West Coast cities, found a 2016 CarGurus study. Fresno, Calif., Portland, Ore., and Seattle are among the top 10 most expensive cities to buy a used car.
The GOBankingRates survey also noted that 35- to 44-year-olds spend the most on their car payments at $198 per month. As respondents age, the number goes down:
- 35- to 44-year-olds: average $198 per month car payment.
- 45- to 54-year-olds: average $189 per month car payment.
- 55- to 64-year-olds: average $159 per month car payment.
- 65+-year-olds average: $76 per month car payment
Other surprising results we found in our survey include:
- Younger and older millennials (ages 18-34) spend the same amount on car payments at $170 per month.
- Women pay more for their cars than men at $171 per month compared to $166 for men.
- A higher income doesn't equal a higher car payment. Respondents making more than $150,000 pay less per month ($198) than those making $100,000-$149,000 ($226) and $75,000-$99,0000 ($206).
Find Out: The Secret to Getting the Lowest Auto Loan Rate at the Dealership
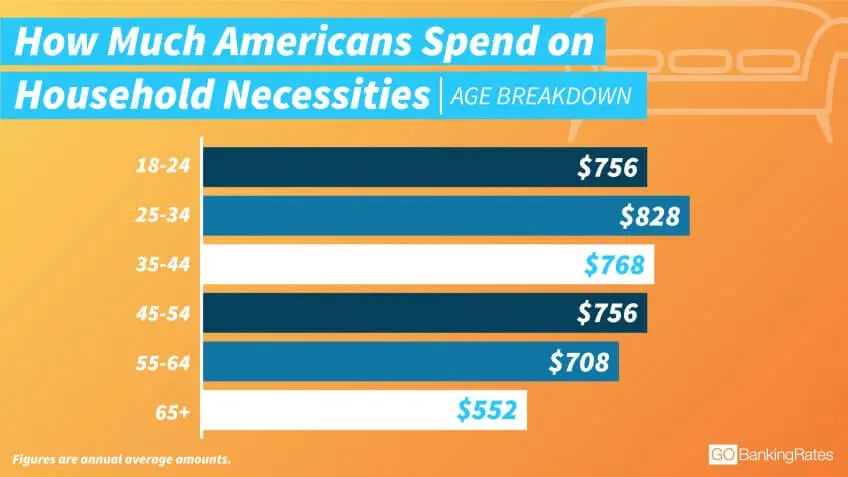
Older Millennials Spend the Most on Household Necessities
As millennials reach age 25, their monthly spending for household necessities — such as toilet paper, paper towels and toothpaste — jumps to the highest of any age group. Monthly spending rises from an average of $63 per month ($756 per year) for 18- to 24-year-olds to $69 per month ($828 per year) for 25- to 34-year-olds.
The jump coincides with a bump in average income for millennials from $528 per week at age 20 to 24 to $758 per week between ages 25 and 34, according to the BLS (as reported by Inc. Magazine). The increase also coincides with the age when many millennials move out of their parents' home and start their own families.
The GOBankingRates survey revealed that household expenses increase significantly when respondents make $75,000 or more. However, people making less than $25,000 per year spend the greatest percentage of their income on household necessities at 3.25 percent. As income increases, the percentage of income toward these necessities steadily declines, even though the average cost rises:
|
Annual Income |
Annual Household Necessities Budget |
Percentage of Income |
|
$24,000 |
$780 |
3.25% |
|
$49,000 |
$708 |
1.44% |
|
$74,000 |
$696 |
0.94% |
|
$99,000 |
$888 |
0.89% |
|
$125,000 |
$852 |
0.68% |
|
$150,000 |
$876 |
0.58% |
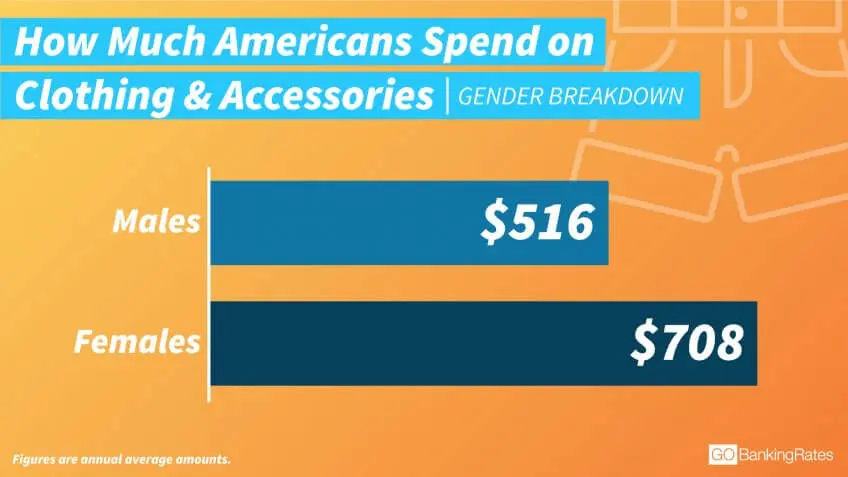
Yes, Women Spend More on Clothing — But Why?
So how much do Americans spend on clothes? Perhaps it's not a shock that women spend an average of $16 more each month on clothing and accessories than men. But perhaps there's a bigger reason that doesn't include the stereotype that "women just like to shop more than men."
For example, female products tend to cost more than men's products. Specifically, adult women's clothing costs 8 percent more, on average, found the New York City Department of Consumer Affairs. That's just an average, however. The reality at checkout can be even more alarming. For example, you could pay more than $200 for a pair of slouchy boyfriend jeans marketed toward women. Or, pay less to get the real thing: A pair of Levi 514 straight fit stretch jeans for men costs less than $35 online.
There's also the gender tax or markup, commonly known as the "pink tax." According to the Joint Economic Committee, the "pink tax" has women paying more for certain items solely based on gender.
Part of the gender tax is due to the actual expense that gets passed down to the consumer. For example, imported clothing for women is taxed at 15.1 percent, 3.2 percent higher than clothing designed for men, according to the JEC. Other gender cost differences in clothing come from price discrimination — "the practice of charging customers different prices for the same product," as defined by the JEC. For example, an oversize cardigan for women might run $158 while you could pick up a man's cardigan of similar style and design for $94.
What was surprising in the GOBankingRates survey was regional data. Residents in Southern states outspend the Northeast in wardrobe expenditures. People in the Northeastern states shell out $49 per month, as did people in the West. However, Southerners dedicate more to fashion at a monthly outlay of $57.
Up Next: 6 Really Dumb Ways Americans Waste Money
Methodology: GOBankingRates conducted five surveys to find out how Americans spend their money. Consumers were asked the following questions: 1) How much money do you spend on your monthly mortgage or rent payment? 2) How much money do you spend on your monthly car payment (lease or finance)? 3) About how much money do you spend each month on groceries? 4) About how much money do you spend on household necessities each month (toilet paper, paper towels, toothpaste, etc.)? 5) About how much money do you spend each month on clothing and clothing accessories? These surveys were conducted from May 1, 2017, to May 3, 2017, with a margin of error ranging from 2.1 percent to 2.9 percent per survey. Each survey included a sample of at least 1,000 respondents.


