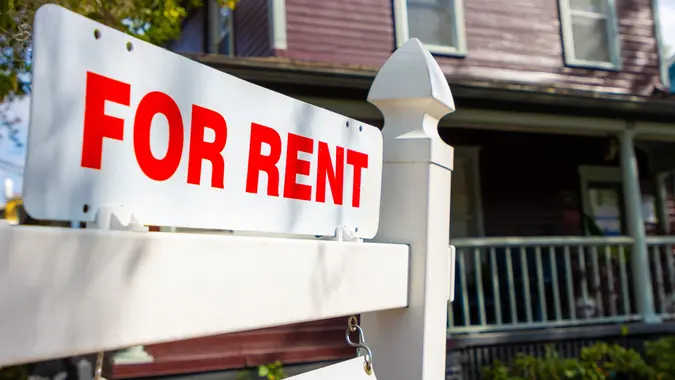
10 Cities Where Renting Is Now More Expensive Than Owning a Home

Commitment to Our Readers
GOBankingRates' editorial team is committed to bringing you unbiased reviews and information. We use data-driven methodologies to evaluate financial products and services - our reviews and ratings are not influenced by advertisers. You can read more about our editorial guidelines and our products and services review methodology.

20 Years
Helping You Live Richer

Reviewed
by Experts

Trusted by
Millions of Readers
Buying a home isn’t always the best financial move to make. It’s something you should do only if you can very comfortably afford it. Unless we’re living debt-free and have a good amount of money reserved for a down payment on a home, we need to ditch the idea that renting is irresponsible, as it may actually be the most responsible thing to do.
But we must be extremely careful and look closely at the rent averages in the area we live in. We could be spending far more to rent than we would to own, in which case, owning would likely make a lot more financial sense. In a new study, GOBankingRates analyzed the average cost of rent and mortgages to find the cities where rent is now more expensive. These are the 10 where rent costs the most.
10. Kingsville, Texas
- Average value of single-family home: $139,640
- Average monthly mortgage cost: $731
- Average monthly rent: $1,661
- How much more rent costs than mortgage, annually: $11,167
9. Meridian, Mississippi
- Average value of single-family home: $109,766
- Average monthly mortgage cost: $574
- Average monthly rent: $1,519
- How much more rent costs than mortgage, annually: $11,341
8. Detroit
- Average value of single-family home: $74,631
- Average monthly mortgage cost: $390
- Average monthly rent: $1,348
- How much more rent costs than mortgage, annually: $11,497
7. Holly Hill, Florida
- Average value of single-family home: $210,248
- Average monthly mortgage cost: $1,100
- Average monthly rent: $2,079
- How much more rent costs than mortgage, annually: $11,751
6. Camden, New Jersey
- Average value of single-family home: $141,491
- Average monthly mortgage cost: $740
- Average monthly rent: $1,724
- How much more rent costs than mortgage, annually: $11,807
5. Hazelton, Pennsylvania
- Average value of single-family home: $203,708
- Average monthly mortgage cost: $1,066
- Average monthly rent: $2,150
- How much more rent costs than mortgage, annually: $13,012
4. Markham, Illinois
- Average value of single-family home: $139,577
- Average monthly mortgage cost: $730
- Average monthly rent: $2,517
- How much more rent costs than mortgage, annually: $21,438
3. Artesia, New Mexico
- Average value of single-family home: $220,533
- Average monthly mortgage cost: $1,154
- Average monthly rent: $3,242
- How much more rent costs than mortgage, annually: $25,056
2. Ventnor City, New Jersey
- Average value of single-family home: $686,474
- Average monthly mortgage cost: $3,591
- Average monthly rent: $7,769
- How much more rent costs than mortgage, annually: $50,134
1. Margate City, New Jersey
- Average value of single-family home: $1,166,315
- Average monthly mortgage cost: $6,101
- Average monthly rent: $19,650
- How much more rent costs than mortgage, annually: $162,582
Methodology: For this study, GOBankingRates analyzed the average cost of rent and mortgages to find places where rent is more expensive. Using Zillow Research Data’s Zillow Home Value Index and Zillow Observed Rental Index the average single-family home value and average rental cost per month can be sourced. By assuming a 20% down payment and using the national average 30-year fixed mortgage rate, as sourced from the Federal Reserve Economic Data, the average mortgage cost can be calculated. The difference in rent and mortgage was calculated and the top 100 places with a cheaper rent than mortgage were kept for this study. The livability index was sourced from AreaVibes and included as supplemental information. The total population, population ages 65 and over, total households, and household median income were all sourced from the US Census American Community Survey and included as supplemental information. To be qualified for this study, all places had to have all data sources available. All data was collected on and is up to date as of April 21, 2025.
 Written by
  Edited by


