13 Cities in Texas Where Renting Is Now More Expensive Than Owning

Commitment to Our Readers
GOBankingRates' editorial team is committed to bringing you unbiased reviews and information. We use data-driven methodologies to evaluate financial products and services - our reviews and ratings are not influenced by advertisers. You can read more about our editorial guidelines and our products and services review methodology.

20 Years
Helping You Live Richer

Reviewed
by Experts

Trusted by
Millions of Readers
This time a year ago, the Texas real estate market was a lot more competitive, primarily due to lack of inventory. In 2025, inventory in the Lone Star State has vastly increased. This substantial boost in available homes greatly opens up opportunities for first-time buyers. Additionally, the number of homes sold was down 5.4% year over year, as of April. When home sales numbers are down, prices fall.
You’ve got two big incentives to buy in Texas overall, but there’s a third one in select cities: paying less than you would if renting. In a new study, GOBankingRates analyzed the average cost of rent and mortgages to find where rent is higher than the average mortgage. These are the 13 cities in Texas where rent is substantially higher than the average mortgage.
13. Seagoville
- Average value of single-family home: $274,439
- Average monthly mortgage cost: $1,436
- Average monthly rent: $1,961
- How much more rent costs than mortgage, annually: $6,308
12. Port Arthur
- Average value of single-family home: $108,467
- Average monthly mortgage cost: $567
- Average monthly rent: $1,098
- How much more rent costs than mortgage, annually: $6,371
11. Brownsville
- Average value of single-family home: $192,471
- Average monthly mortgage cost: $1,007
- Average monthly rent: $1,547
- How much more rent costs than mortgage, annually: $6,480
10. Glenn Heights
- Average value of single-family home: $334,328
- Average monthly mortgage cost: $1,749
- Average monthly rent: $2,294
- How much more rent costs than mortgage, annually: $6,542
9. La Marque
- Average value of single-family home: $227,795
- Average monthly mortgage cost: $1,192
- Average monthly rent: $1,751
- How much more rent costs than mortgage, annually: $6,717
8. Lancaster
- Average value of single-family home: $278,488
- Average monthly mortgage cost: $1,457
- Average monthly rent: $2,021
- How much more rent costs than mortgage, annually: $6,767
7. Watauga
- Average value of single-family home: $276,674
- Average monthly mortgage cost: $1,447
- Average monthly rent: $2,038
- How much more rent costs than mortgage, annually: $7,086
6. Forest Hill
- Average value of single-family home: $227,152
- Average monthly mortgage cost: $1,188
- Average monthly rent: $1,802
- How much more rent costs than mortgage, annually: $7,358
5. Del Rio
- Average value of single-family home: $207,753
- Average monthly mortgage cost: $1,087
- Average monthly rent: $1,800
- How much more rent costs than mortgage, annually: $8,558
4. Groves
- Average value of single-family home: $166,719
- Average monthly mortgage cost: $872
- Average monthly rent: $1,595
- How much more rent costs than mortgage, annually: $8,674
3. Balch Springs
- Average value of single-family home: $231,719
- Average monthly mortgage cost: $1,212
- Average monthly rent: $1,946
- How much more rent costs than mortgage, annually: $8,802
2. Mission
- Average value of single-family home: $222,237
- Average monthly mortgage cost: $1,163
- Average monthly rent: $1,941
- How much more rent costs than mortgage, annually: $9,341
1. Kingsville
- Average value of single-family home: $139,640
- Average monthly mortgage cost: $731
- Average monthly rent: $1,661
- How much more rent costs than mortgage, annually: $11,167
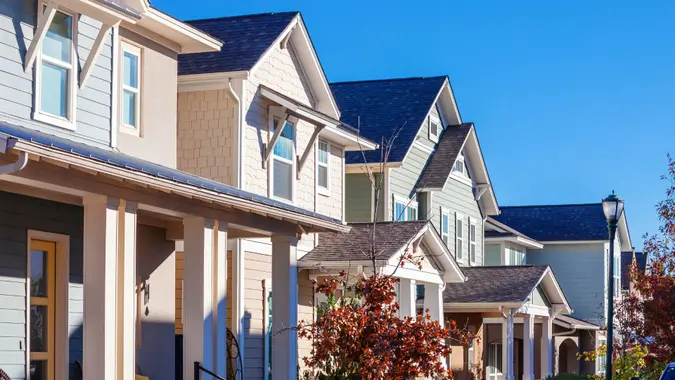
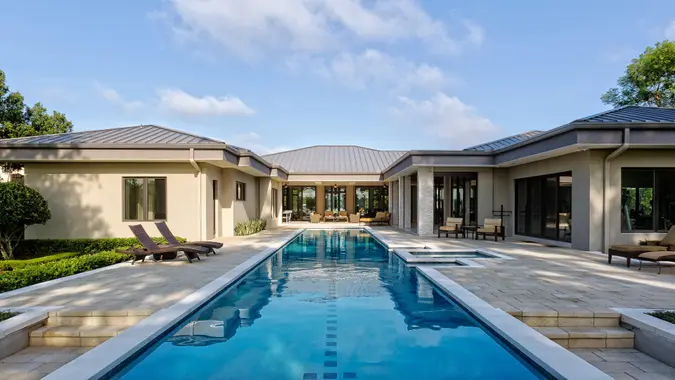
Editor’s note: Photos are for representational purposes only and might not reflect the exact locations listed in this article.
Methodology: For this study, GOBankingRates analyzed the average cost of rent and mortgages to find places where rent is more expensive. Using Zillow Research Data’s Zillow Home Value Index and Zillow Observed Rental Index the average single-family home value and average rental cost per month can be sourced. By assuming a 20% down payment and using the national average 30-year fixed mortgage rate, as sourced from the Federal Reserve Economic Data, the average mortgage cost can be calculated. The difference in rent and mortgage was calculated and the top 100 places with a cheaper rent than mortgage were kept for this study. The livability index was sourced from AreaVibes and included as supplemental information. The total population, population ages 65 and over, total households, and household median income were all sourced from the U.S. Census American Community Survey and included as supplemental information. To be qualified for this study, all places had to have all data sources available. All data was collected on and is up to date as of April 21, 2025.
 Written by
  Edited by


