What Is Price to Book Ratio or P/B?
 Written by
Angela Mae Watson
Written by
Angela Mae Watson
 Edited by
Emily Gadd, CCC™
Edited by
Emily Gadd, CCC™

Commitment to Our Readers
GOBankingRates' editorial team is committed to bringing you unbiased reviews and information. We use data-driven methodologies to evaluate financial products and services - our reviews and ratings are not influenced by advertisers. You can read more about our editorial guidelines and our products and services review methodology.
20 Years
Helping You Live Richer
Reviewed
by Experts
Trusted by
Millions of Readers
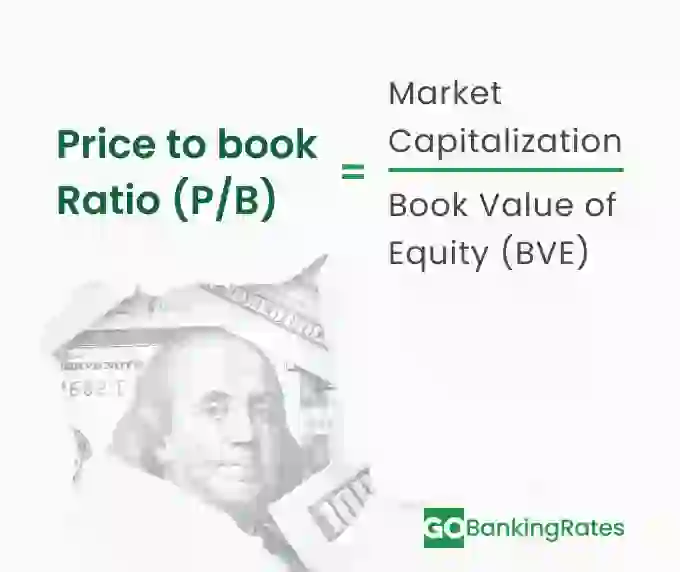
The price-to-book ratio, or P/B ratio, is one of several metrics that help analysts and investors evaluate a company’s value. The P/B ratio is essentially the Market Price Per Share divided by the Book Value Per Share.
This specific measure compares a company’s stock price to its book value. P/B ratios compare the company’s market capitalization with its book value, indicating whether a stock is trading under or over market value.
Generally, a lower P/B ratio is better, but lower values are not always a good thing. According to Forbes, investors often analyze P/B ratios in value investing.
Continue reading to learn about the P/B ratio and how analysts utilize it to assess a company’s value.
What Is Book Value and Why Does It Matter?
Understanding book value is important for several reasons. For starters, it’s a key variable in the P/B ratio formula. It can also give you a better idea of what a company is valued at (after excluding any liabilities).
One way to think about book value is, essentially, as the net asset value of a company if it were to be liquidated. It’s calculated by subtracting a firm’s intangible assets and liabilities from its total assets. In other words, it’s the value the company would have on a balance sheet.
Here’s an example. Say a company has a total number of assets equaling $30 million and a total of $12 million in liabilities. The book value is $18 million ($30 million minus $12 million).
How to Calculate the Price-to-Book Ratio
The P/B ratio is an essential metric for investors to understand the value of a company. To calculate a P/B ratio, divide a given company’s stock price per share by its book value per share. To calculate its book value per share, take the book value and divide it by the total number of outstanding shares.
The P/B formula is:
- Market Price per Share divided by the Book Value Per Share
Take an imaginary company’s stock as an example. Assume the company has a market cap of $1 billion, and its stock is currently trading at $10.
This hypothetical company has $100 million in assets and $50 million in liabilities on its balance sheet. Therefore, the book value of this company is $50 million ($100 million – $50 million = $50 million). If this company had 10 million outstanding shares, its book value per share would be $5 ($50 million divided by $10 million).
Using the P/B ratio formula, divide the market price per share by the book price per share. The P/B ratio for this imaginary company equals 2. In other words, the stock is trading at twice its book value.
How to Find Book Value Per Share (BVPS)
On its own, the “book value” is determined by taking the value of a company’s assets and subtracting any liabilities. But to get the Book Value Per Share (BVPS), you must:
- Take the total assets and subtract the intangible assets and total liabilities
- Divide that by the number of outstanding shares
Put another way, the BVPS = the Total Shareholders’ Equity divided by Total Outstanding Shares.
Here’s an example.
Let’s assume a company has $20 million in common equity (the total value all common shareholders have invested in the company) and 10 million outstanding shares. The BVPS would be $2.
What Is a Good Price-to-Book Ratio?
Lower P/B ratios can identify undervalued or cheap stocks. According to Forbes, any value below 1.0 indicates a potential bargain. Yet some growth companies can trade at multiples of their book value, so it depends on what sector you’re evaluating. It’s just as possible to find a company with a higher P/B ratio that still offers solid returns for shareholders.
If a company has a high P/B ratio (greater than 1.0), it could mean the stock is overvalued. This doesn’t necessarily mean the stock will continue to perform well in the future, though it might. Note that a lower P/B ratio doesn’t guarantee a good investment either. It depends on many other factors, including the industry and likelihood of it gaining value over time.
Here’s an example of where a higher P/B ratio was actually a good thing.
In 2024, Apple had a P/B ratio of 67.88. While it’s since gone down (50.2 in March 2025), the company’s stock has continued to perform better than expected over time. But Apple is an unusual case. A manufacturing company with a similarly high P/B, for example, might be seen as a red flag for investors.
Like most valuation measures, there isn’t a single answer for what constitutes a “good” numeric value. While lower P/B ratios are generally better, it’s essential to use the metric as a relative comparison with other companies of the same size and in the same sector.
For a company with a high P/B ratio, you’ll want to investigate its financials further to determine whether that valuation makes sense.
Limitations of the Price-to-Book Ratio
The price to book ratio takes book value into account, entailing that it can suffer from the impact of large and sudden expenses. This can happen because of accounting practices that require companies to realize those expenses immediately.
One example of this is the expense of research and development efforts. R&D expenses affect a company’s book value, even though its investors may value such R&D efforts as a potential book for the company in the future. Sometimes, more context is needed to determine whether intangible assets are a hidden value or a value killer in any business.
Book values can be negative when a company has a series of negative earnings. Here, the metric becomes nearly useless for comparing the value of similar firms.
Comparing the P/B ratios of vastly different-sized companies or companies in disparate industries is a waste of time. To get the most out of this relative comparison, you should compare companies with similar market capitalizations within the same industry.
Here are a few other notable limitations of using this metric to value investments.
Non-Tangible Assets Exclusion
The P/B ratio doesn’t necessarily account for intellectual property or goodwill. Nor does it account for non-tangible assets, which can include a wide range of things, including:
- Goodwill
- Trademarks
- Copyrights
- Patents
- Brand recognition
All these factors can influence the value of a company, making the P/B ratio potentially less accurate.
Industry Variability
Of course, not all industries are the same. Thus, not all industries can benefit from P/B ratio analysis.
Take industries that primarily offer information or services. These companies might not have as many tangible assets as others. Even if you were to take the book value and Book Value Per Share, you wouldn’t necessarily get an accurate valuation.
Dependent on Accurate Book Value
You can find a company’s market price per share online. But there’s always the possibility that this information, which is crucial in determining the P/B ratio, is outdated or inaccurate. In this case, the information can be misleading.
How to Use the Price-to-Book Ratio In Your Investments
The P/B ratio only refers to a firm’s stock price compared with its book value. This metric doesn’t consider other factors like sales or profits. It’s certainly not advisable to assess the value of a company based on its P/B ratio alone. This ratio is just one of many important valuation metrics that analysts and investors should research.
The price-to-book ratio can be used to make your own investments. But do so with the following considerations.
Combine with Other Metrics
It’s often helpful to use the price-to-book ratio alongside a few other metrics, like:
- Price to Sales
- Price to Earnings (P/E)
- Price to Cash Flow
- Return on Equity (ROE)
This can give you a more comprehensive view of the stock’s value.
For example, the P/E ratio is used to determine a stock’s price as divided by its earnings per share. Once you have that value, you can use it to determine a company’s price-to-earnings growth (PEG), which can also help determine if a stock is under- or overvalued.
Alternatively, you can use a company’s return on equity to see how well it’s performing. This metric can help standardize the company’s performance, which allows investors to make comparisons. You can calculate ROE by taking a company’s net income and dividing it by the total shareholder equity.
Focus on Long-Term Potential
The P/B ratio alone doesn’t account for a company’s long-term growth potential. It primarily focuses on current data. As an investor, it’s important to evaluate a company’s growth trajectory along with the P/B ratio for a more accurate assessment of its potential returns.
Research Industry Benchmarks
Along with finding a company’s P/B ratio, take the time to compare ratios within the same sector for meaningful insights. You can use common industry benchmarks — like average annual returns — to measure the performance and returns of stocks and other investments.
As a general rule, you’ll want to compare similar companies with one another. For example, you might use the S&P 500 to help measure a particular large-cap U.S. stock since the S&P 500 specifically tracks these companies.
Just know that comparing industry benchmarks isn’t a guarantee of future performance. It’s generally best to conduct some long-term comparisons to ensure you have the most accurate data.
FAQ
- What does the price-to-book ratio measure?
- A company's P/B ratio measures its market valuation in relation to its book value (total assets minus total liabilities).
- How do I calculate the book value per share?
- To get the Book Value Per Share, or BVPS, take the total shareholders' equity and divide it by the number of total outstanding shares.
- What is considered a good P/B ratio?
- A good P/B ratio is anything below 1.0. However, this depends on other factors, such as industry, so keep that in mind when choosing investments.
- Why do some industries have higher P/B ratios?
- A P/B ratio doesn't account for everything. If a company is in an industry with more intangible assets, for example, it might have a higher P/B ratio. This is because these types of assets are harder to measure.
- How does the P/B ratio differ from the P/E ratio?
- The P/B ratio measures a company's intrinsic value based on its book value. It takes assets, liabilities and intangible assets into account. The price-to-earnings ratio, on the other hand, measures a company's worth based on its profits.
- Both ratios can help investors measure a company's value. It's essential to compare P/B ratios between similar-sized companies in the same industry.
- Can a low P/B ratio indicate a bad investment?
- A low P/B ratio indicates that a stock is undervalued. But a low P/E ratio doesn't guarantee a good investment either.
- A low P/B ratio may also be a warning sign of other problems in a firm. Recall that the P/B ratio goes down as the stock price declines. Thus, for a company whose stock price is in decline due to problems of some kind, the P/B ratio will also decline.
- To get a clearer picture of what makes a good or bad investment, you may want to include other metrics -- like P/E or Price to Sales.
- When should I use the P/B ratio?
- A price to book ratio is a useful measure that value investors calculate to identify potentially undervalued stocks. The metric indicates the worth that investors place on a company's equity relative to its book value.
Scott Jeffries contributed to the reporting of this article.
Our in-house research team and on-site financial experts work together to create content that’s accurate, impartial, and up to date. We fact-check every single statistic, quote and fact using trusted primary resources to make sure the information we provide is correct. You can learn more about GOBankingRates’ processes and standards in our editorial policy.
- FINRA "Get Off the Bench: A Look at Benchmarks"
- Harvard Business School "How to Calculate Return on Equity (ROE) & Why It Matters"
- WIPO "Intangible Assets and Intellectual Property"
- Companies Market Cap "Apple (AAPL) - P/B ratio"
- CFI "Market to Book Ratio"
- Forbes "6 Most Undervalued Stocks To Buy In October 2024"
- Sharestates "Common Equity"
- Forbes "Separating Winners From Losers: Low Price-To-Book Stocks"


