This Is My Definition of a ‘Rich’ Life — and It Should Be Yours Too
 Written by
Sally Elbassir
Written by
Sally Elbassir

Commitment to Our Readers
GOBankingRates' editorial team is committed to bringing you unbiased reviews and information. We use data-driven methodologies to evaluate financial products and services - our reviews and ratings are not influenced by advertisers. You can read more about our editorial guidelines and our products and services review methodology.
20 Years
Helping You Live Richer
Reviewed
by Experts
Trusted by
Millions of Readers
What does it mean to live a rich life? Perhaps it means being able to afford multiple luxurious cars. Or, maybe it’s defined by living in close proximity to loved ones. Alternatively, a rich life can be measured by the freedom to live according to one’s own standards.
No matter how you define a rich life, there’s no question that it is at least partially defined by the quality of living in relation to income. To determine the best places to live for families, GOBankingRates evaluated all 50 states by analyzing 12 data points across various sources, focusing on factors such as household income, employment, cost of living and safety.
As someone who used to live in California but now spends most of her time abroad, I can attest to the fact that although the glamorous and beautiful cities of the world are popular for a reason, a rich life is much more attainable when people can live below their means and save. Thus, I’ve come to define a rich life as one that allows me the flexibility to earn income on my own terms and live below my means in a thriving city.
Click through to see where homes in America are still affordable.
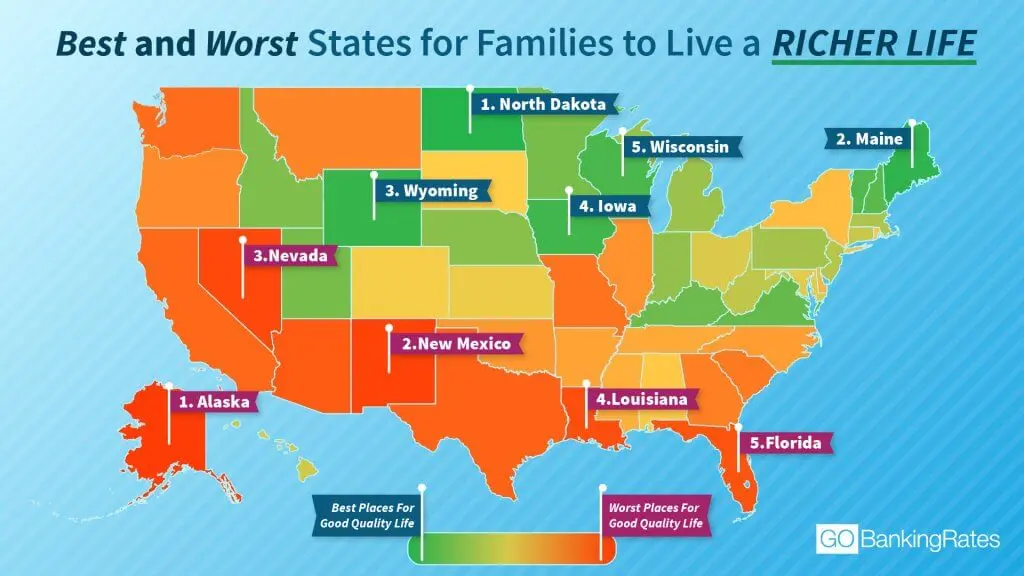
According to the study, the 10 best states to live a richer life don’t include those with the highest cost of living such as California, one of the most expensive states in the United States. Many Americans dream of living in alluring New York, sunny California or tropical Hawaii, but the reality is that many residents of these states are unable to afford the life they’ve imagined due to the high cost of living. Those living in the best states for families, as defined by this study, enjoy benefits such as affordable housing, higher household incomes and a low rate of violent crime.
This means that if you and your family want to live a richer life, you don’t necessarily have to work more hours or win the lottery. Rather, if you relocate to a state that offers a good quality of living at an affordable price, you might find that you’re wealthier than you think.
As a former corporate-life Californian-turned-digital nomad, I’m now able to afford a life that I’d only dreamed of, despite earning a third of my original income. I do this by spending extended periods of time abroad, oftentimes in countries where my income exceeds that of the average resident. In doing so, I’m able to redefine the idea of a rich life.
Living richly is no longer defined by earning and spending large sums of money. Rather, it’s the ability to live comfortably and affordably, something that is more easily done in some cities than others.
Do you live in one of the best states for families to live a rich life? Here’s a look at how all 50 states ranked among five major categories:
| Overall Rank | State | Median Household Income | Median Home List Price | Child Care Costs | Avg. Family Health Insurance Premium Total | Violent Crimes per 1000 People |
| 1 | North Dakota | $59,114 | $229,000.00 | $16,254 | $16,804 | 2.51 |
| 2 | Maine | $50,826 | $229,900.00 | $18,360 | $17,987 | 1.24 |
| 3 | Wyoming | $59,143 | $240,000.00 | $18,720 | $19,617 | 2.44 |
| 4 | Iowa | $54,570 | $179,900.00 | $18,186 | $16,123 | 2.91 |
| 5 | Wisconsin | $54,610 | $199,900.00 | $21,918 | $17,477 | 3.06 |
| 6 | Vermont | $56,104 | $250,000.00 | $21,522 | $17,795 | 1.58 |
| 7 | New Hampshire | $68,485 | $289,900.00 | $22,152 | $19,066 | 1.98 |
| 8 | Virginia | $66,149 | $299,900.00 | $22,360 | $17,945 | 2.18 |
| 9 | Kentucky | $44,811 | $175,000.00 | $12,112 | $16,678 | 2.32 |
| 10 | Utah | $62,518 | $349,000.00 | $18,645 | $17,025 | 2.43 |
| 11 | Minnesota | $63,217 | $265,900.00 | $27,144 | $17,545 | 2.43 |
| 12 | Idaho | $49,174 | $289,900.00 | $13,461 | $17,499 | 2.3 |
| 13 | Nebraska | $54,384 | $205,000.00 | $17,192 | $16,617 | 2.91 |
| 14 | Indiana | $50,433 | $170,000.00 | $21,329 | $17,996 | 4.05 |
| 15 | Michigan | $50,803 | $169,500.00 | $17,561 | $17,113 | 4.59 |
| 16 | Pennsylvania | $54,895 | $198,900.00 | $21,363 | $17,900 | 3.16 |
| 17 | Massachusetts | $70,954 | $429,900.00 | $34,381 | $18,955 | 3.77 |
| 18 | New Jersey | $73,702 | $299,000.00 | $22,709 | $18,242 | 2.45 |
| 19 | West Virginia | $42,644 | $150,000.00 | $15,600 | $17,260 | 3.58 |
| 20 | Connecticut | $71,755 | $315,000.00 | $27,144 | $18,637 | 2.27 |
| 21 | Hawaii | $71,977 | $599,000.00 | $1,868 | $16,362 | 3.09 |
| 22 | Ohio | $50,674 | $154,900.00 | $17,675 | $17,523 | 3 |
| 23 | Maryland | $76,067 | $300,000.00 | $24,470 | $18,519 | 4.72 |
| 24 | Kansas | $53,571 | $175,000.00 | $20,309 | $16,784 | 3.8 |
| 25 | Colorado | $62,520 | $416,050.00 | $26,367 | $17,459 | 3.43 |
| 26 | South Dakota | $52,078 | $228,250.00 | $12,396 | $17,117 | 4.18 |
| 27 | Alabama | $44,758 | $194,500.00 | $10,653 | $16,098 | 5.32 |
| 28 | Rhode Island | $58,387 | $290,000.00 | $23,223 | $18,010 | 2.39 |
| 29 | New York | $60,741 | $384,900.00 | $27,092 | $19,375 | 3.76 |
| 30 | Delaware | $61,017 | $279,990.00 | $19,220 | $18,648 | 5.09 |
| 31 | Mississippi | $40,528 | $175,500.00 | $9,734 | $15,765 | 2.8 |
| 32 | Tennessee | $46,574 | $229,900.00 | $15,814 | $16,721 | 6.33 |
| 33 | Arkansas | $42,336 | $165,000.00 | $11,338 | $14,929 | 5.51 |
| 34 | North Carolina | $48,256 | $259,000.00 | $17,174 | $16,986 | 3.72 |
| 35 | Oklahoma | $48,038 | $179,900.00 | $14,533 | $16,646 | 4.5 |
| 36 | Illinois | $59,196 | $224,900.00 | $23,426 | $18,510 | 4.36 |
| 37 | Oregon | $53,270 | $365,000.00 | $18,645 | $17,127 | 2.65 |
| 38 | Montana | $48,380 | $311,700.00 | $17,090 | $17,835 | 3.68 |
| 39 | Georgia | $51,037 | $248,000.00 | $14,395 | $18,252 | 3.98 |
| 40 | South Carolina | $46,898 | $242,994.50 | $12,393 | $17,673 | 5.02 |
| 41 | Missouri | $49,593 | $170,000.00 | $16,016 | $16,638 | 5.19 |
| 42 | Washington | $62,848 | $369,900.00 | $24,176 | $18,301 | 3.02 |
| 43 | California | $63,783 | $515,000.00 | $22,716 | $17,458 | 4.45 |
| 44 | Texas | $54,727 | $273,990.00 | $15,703 | $17,529 | 4.34 |
| 45 | Arizona | $51,340 | $275,000.00 | $18,687 | $17,484 | 4.7 |
| 46 | Florida | $48,900 | $289,000.00 | $15,922 | $17,989 | 4.3 |
| 47 | Louisiana | $45,652 | $205,000.00 | $11,265 | $17,330 | 5.66 |
| 48 | Nevada | $53,094 | $299,900.00 | $19,103 | $16,133 | 6.78 |
| 49 | New Mexico | $45,674 | $219,000.00 | $15,569 | $16,954 | 7.02 |
| 50 | Alaska | $74,444 | $278,000.00 | $22,464 | $22,490 | 8.04 |
Click through to find out which states are best (and worst) for rich Americans.
More on Wealth
- These Are the Wealthiest School Districts Across America, Study Finds
- How to Build Wealth Using Other People’s Money
- 12 Essential Money Tips for Every Phase of Your Financial Life
Methodology: GOBankingRates surveyed all 50 states, analyzing 12 data points that served as determining factors in the ranking: (1) median household income, sourced from the Census Bureau’s 2016 American Community Survey; (2) March 2018 unemployment rates, sourced from the Bureau of Labor Statistics; (3) median home listing prices as of March 28, sourced from Zillow; (4) mean effective state property tax (referred to as “property tax”), sourced from the Tax Foundation; (5) state sales tax rates in 2018, sourced from the Tax Foundation; (6) grocery costs, sourced from Missouri Economic Research and Information Center; (7) annual child care costs for an infant and a 4-year-old, sourced from Child Care Aware of America; (8) school district grades, sourced from Education Week; (9) average family health insurance premiums, sourced from Kaiser Family Foundation; (10) employer health insurance contributions, sourced from Kaiser Family Foundation; (11) annual violent crimes per 1,000 residents, sourced from NeighborhoodScout.com; and (12) annual property crimes per 1,000 residents, sourced from NeighborhoodScout.com. Household income and home list prices were weighted double in our analysis.


