43% of Americans File Taxes From the Comfort of Their Home, Survey Finds
 Written by
Elyssa Kirkham
Written by
Elyssa Kirkham

Commitment to Our Readers
GOBankingRates' editorial team is committed to bringing you unbiased reviews and information. We use data-driven methodologies to evaluate financial products and services - our reviews and ratings are not influenced by advertisers. You can read more about our editorial guidelines and our products and services review methodology.
20 Years
Helping You Live Richer
Reviewed
by Experts
Trusted by
Millions of Readers
With tax season coming up, you might be in the process of gathering all of your tax forms. Or, you’re already anticipating the arrival of your big tax refund later this year. But, have you thought about how you’re going to actually file your taxes?
From tax preparation software programs to tax accountants, there are numerous ways you can file your taxes in 2016. But figuring out which method is best for you can be hard, which is why GOBankingRates polled thousands of Americans to uncover their tax-filing habits. Read on to see how your 2016 tax-filing plans compare to taxpayers’ tax-filing preferences, as well as the pros and cons of the different tax-filing methods.
Related: How to Save Money If You Owe Taxes This Year
New Poll Reveals Most Popular Ways to File Taxes
GOBankingRates polled 5,028 Americans on their tax-filing plans for the 2016 tax season by posing the question, “How do you file your taxes?” Respondents could then select one of the following answers, listed in a random order:
- Digital tax-prep tool (i.e. Turbo Tax)
- I have an accountant file my taxes
- A friend or family member does it for me
- I use the IRS forms and calculate myself
- Brick-and-mortar company (i.e. H&R Block)
- I do not file my taxes
- None of the above
Of the answers offered, the most popular way to file taxes is with a digital tax-prep tool with 26.6 percent of respondents selecting this answer. The next most common answer was “none of the above,” which respondents selected 23.1 percent of the time.
Excluding the respondents who answered “None of the above,” GOBankingRates compared different methods of filing taxes to get insights into how taxpayers are most likely to file their taxes this year.
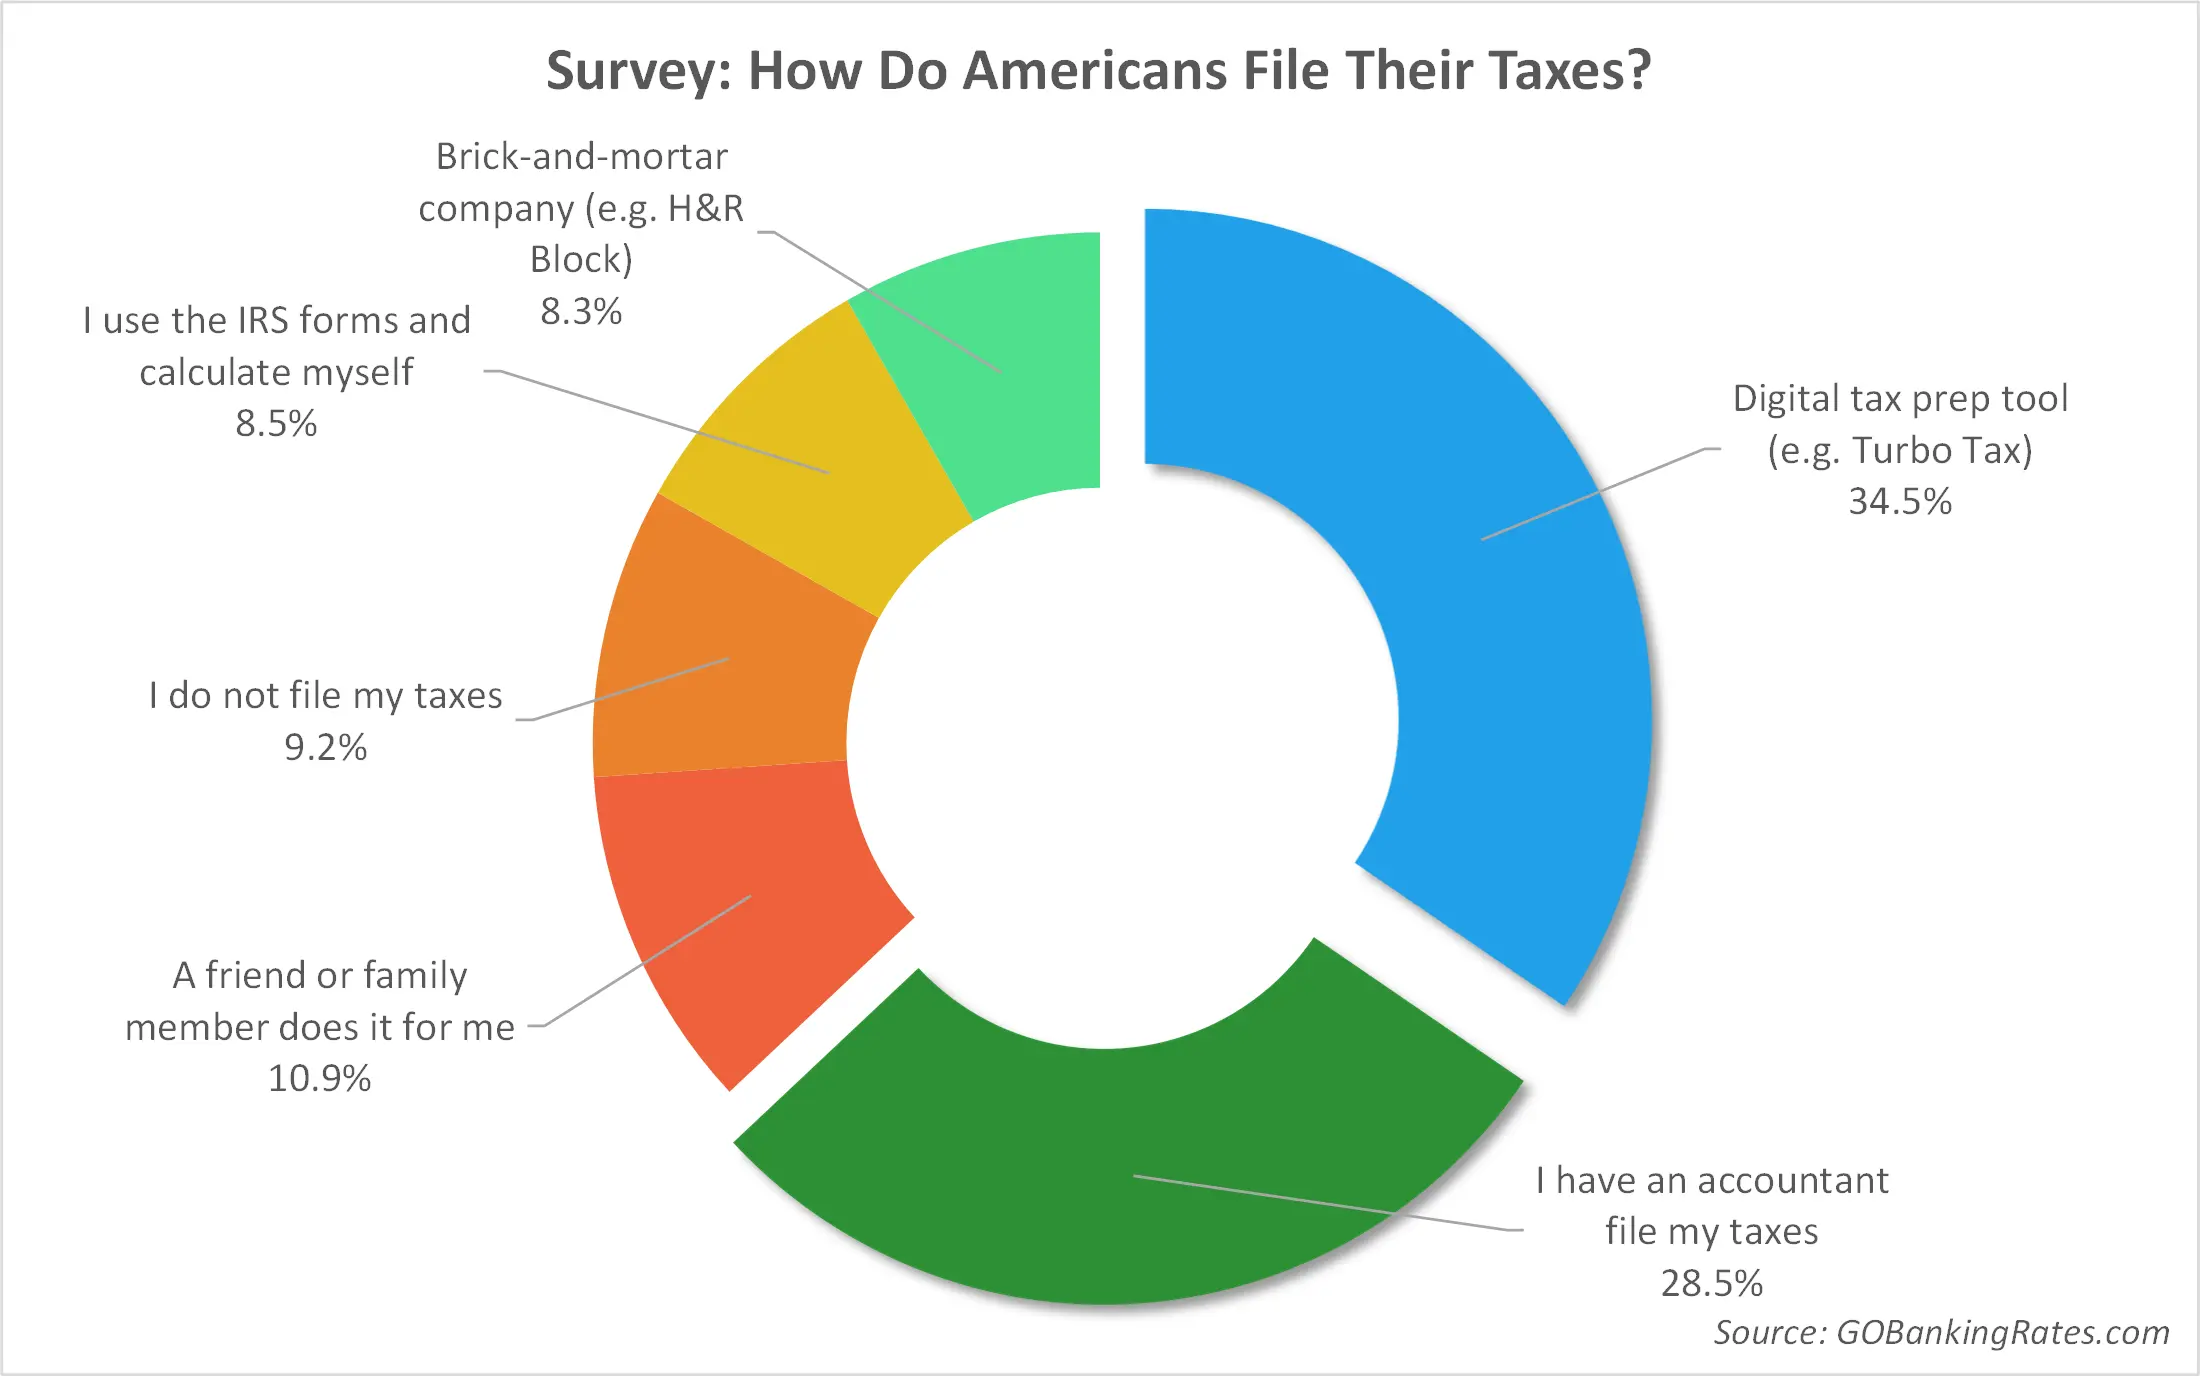
34.5% Use Digital Tax Tools to File
A “digital tax-prep tool” is the most popular option among tax filers, with more than a third (34.5 percent) of survey respondents saying this is the method they use to file taxes. Tax-filing software is a popular option most likely due to the lower costs associated with filing digitally, as well as the ease of using a program to automate calculations and file online.
Using a tax preparation program, filing fees typically start as low as $0 or $10 to file federal and state returns using a basic 1040 form and go up to around $80 or so for more premium or deluxe versions ideal for business owners, landlords, investors, homeowners and others with wider tax-filing needs. The IRS also offers a free tax filing service called Free File, which is available to taxpayers with incomes of $62,000 or less.
36.8% Also Hire a Professional to File Their Taxes
Hiring an accountant to file taxes is almost as common, with 28.5 percent of people saying they prefer this method for filing taxes. Another 8.3 percent choose to file with the help of brick-and-mortar tax companies like H&R Block. Looking at these two groups together shows that 36.8 percent of Americans prefer to hire a tax preparer to file their returns, which means most people prefer to hand this chore off to a paid professional.
A professionally prepared tax return comes at a premium, however; the average fee charged by tax preparers was $273 in 2015, according to data from the National Society of Accountants.
10.9% Get a Friend or Family Member to File for Them
Another 10.9 percent of taxpayers are lucky enough to be able to foist their tax filing off on a family member or friend, likely getting this help for free. The main savings here is time and money since someone else will be going through the work of filling out forms, finding tax deductions and finalizing the return.
However, there could be more room for errors if you have a nonprofessional file taxes on your behalf. And while you’ll save time, you might still be facing a fee for actually filing taxes and getting them processed by the IRS and your state’s tax bureau.
8.5% Still File Taxes By Hand
Around 8.5 percent of survey respondents are holdouts of the pen-and-paper method, which has quickly been outstripped by e-filings. Of the 150.5 million the IRS received in 2015, 85.6 percent were e-filed by individuals or professionals, which means that just 14.4 percent were filed manually.
There’s a major drawback to doing taxes by hand: You’re much more likely to make an error in your calculations, about 10 times more likely, reports U.S. News and World Report. Less than 2.5 percent of e-filed returns contain a taxpayer error compared with 25 percent of paper returns.
Still, the big benefit of filing taxes by hand is that it can be much cheaper since most IRS tax forms can be picked up for free at many libraries and post offices.
9.2% Don’t File Taxes
Last of all are the 9.2 percent who said they don’t file taxes. Some of these respondents could be in the group of Americans who earned less than $10,300 in 2015 and won’t be required to file a tax return for last year. Also in this group could be some of the 7 million taxpayers who are required to file a return but fail to do so each year, according to Forbes.
Read: How To Avoid Paying Taxes Legally
Young Taxpayers Use Tax Software, Older Filers Hire a Professional
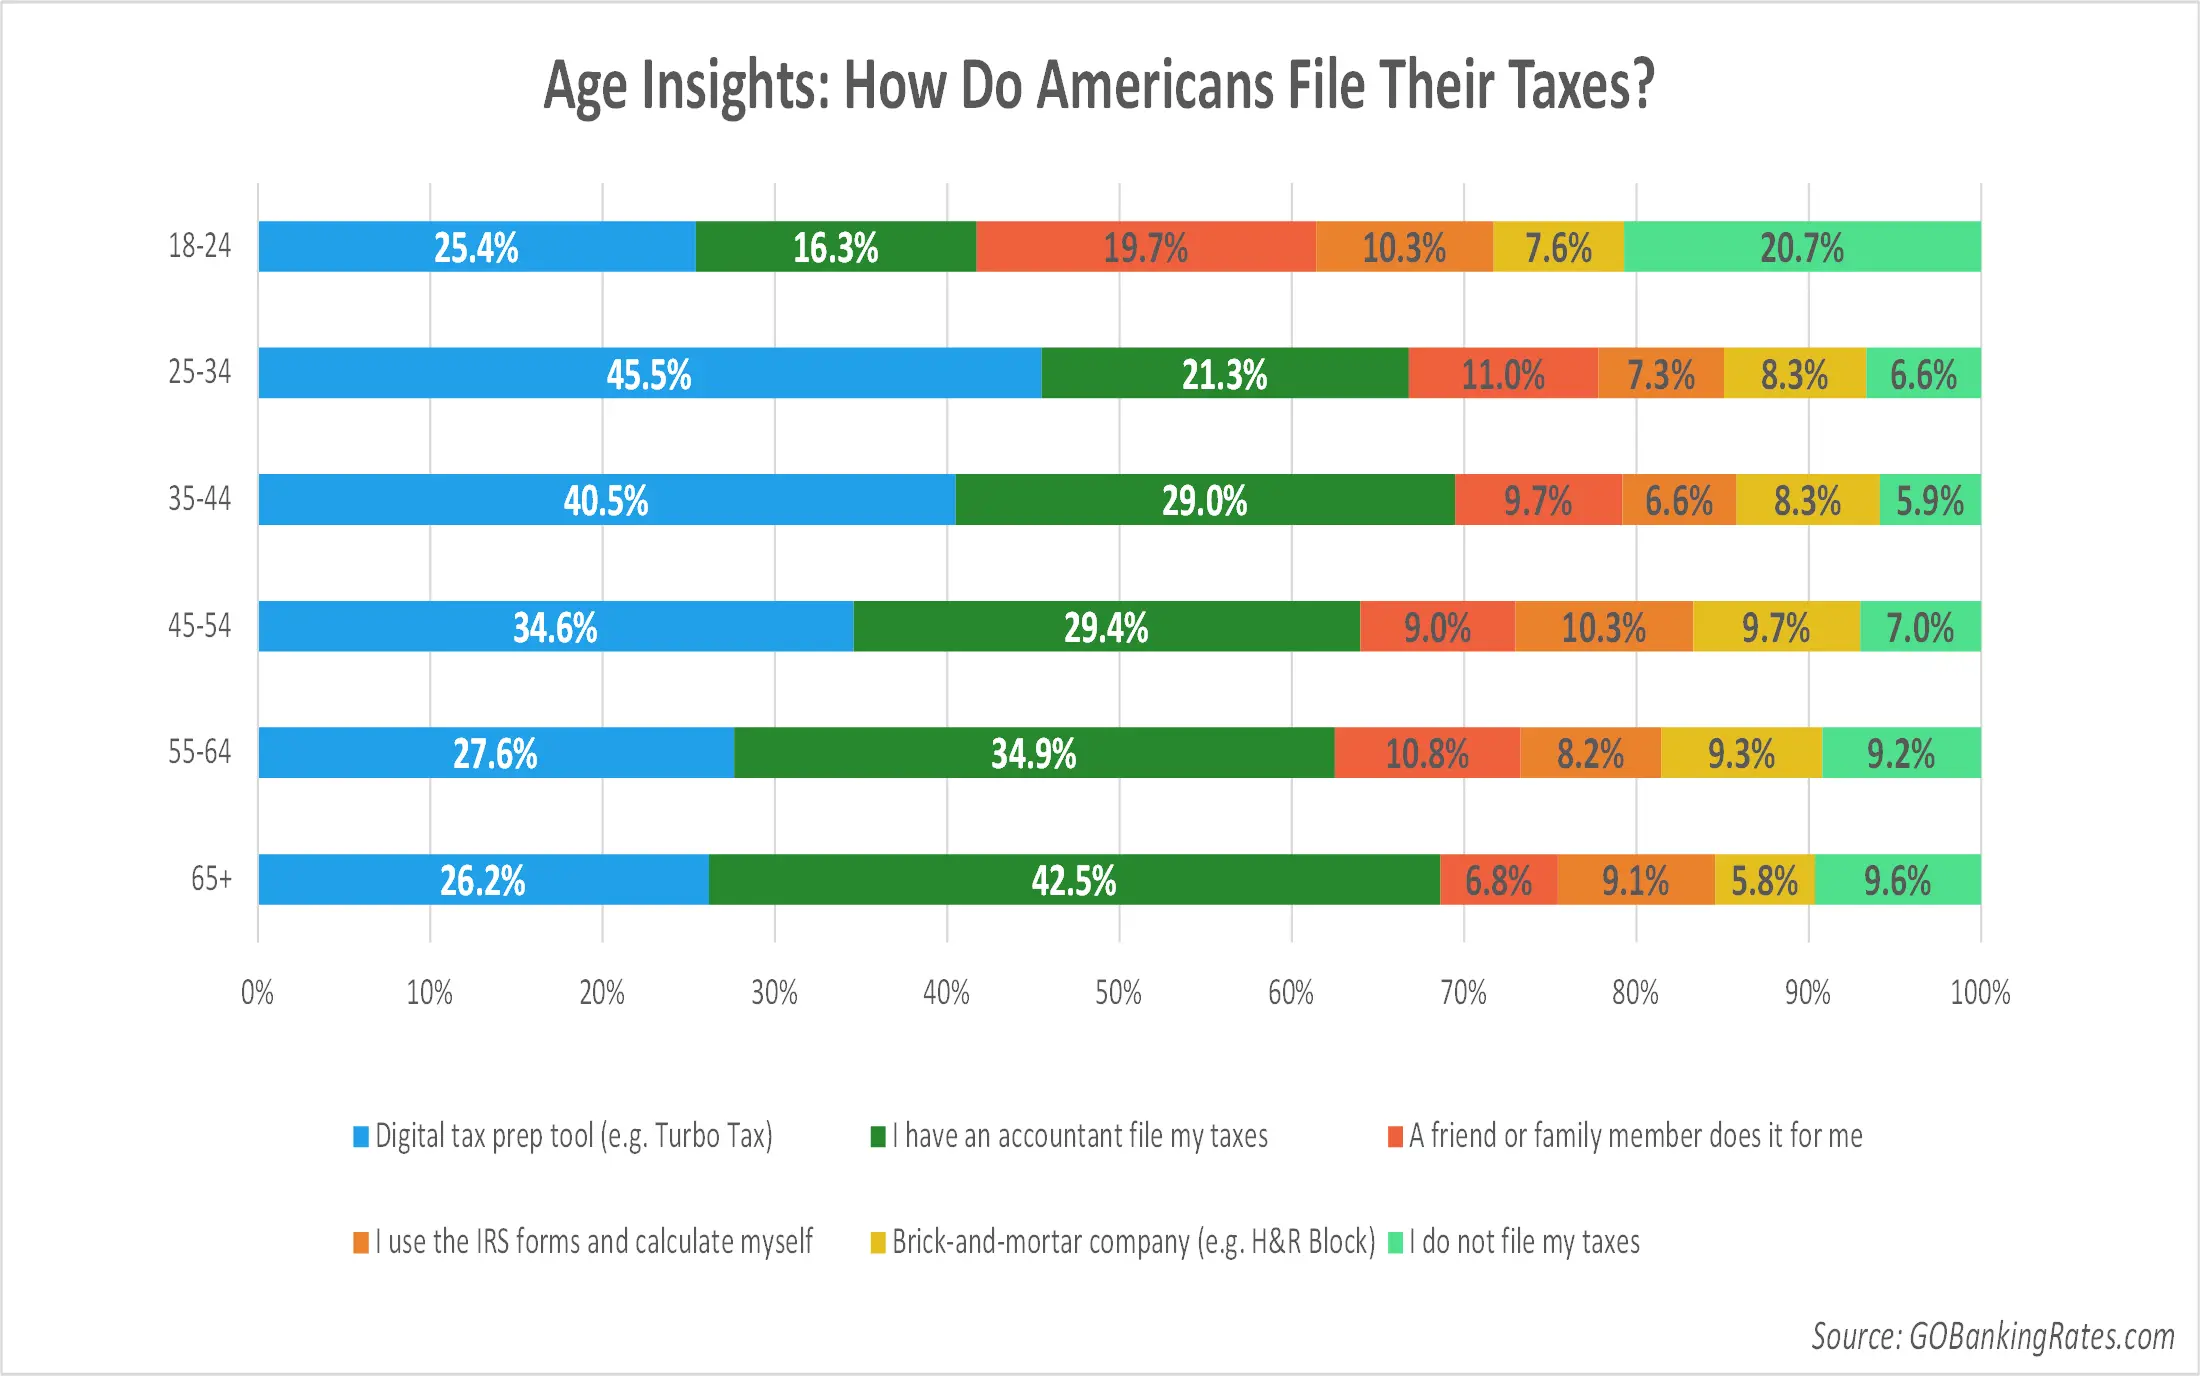
Young millennials (ages 18 to 24) are the most likely not to file taxes, giving this answer more than twice as often compared to the overall survey findings (20.7 percent vs. 9.2 percent). With many in this age group still in college or working part time, it’s likely their incomes aren’t high enough to be required to file a tax return. Another significant portion (19.7 percent) stated that a friend or family member prepares their taxes, which could show that many of these young adults still rely on their parents to file taxes for them.
Interestingly, this age group also has one of the highest percentages of people who said they file taxes on paper at 10.3 percent, tied with the 10.3 percent of those ages 45 to 54 who also selected this answer.
Hiring a professional and using a tax-filing software program are the tax-filing preferences that correlate most closely to the age of the respondent. Younger people are most likely to file taxes using a digital or online tool, with 45.5 percent of those ages 25 to 34 choosing this option compared with just 26.2 percent of taxpayers ages 65 and over.
Conversely, taxpayers 65 and over are about twice as likely to file taxes through an accountant (42.5 percent) compared to those ages 25 to 34 (21.3 percent).
Both Men and Women Prefer Tax-Filing Software
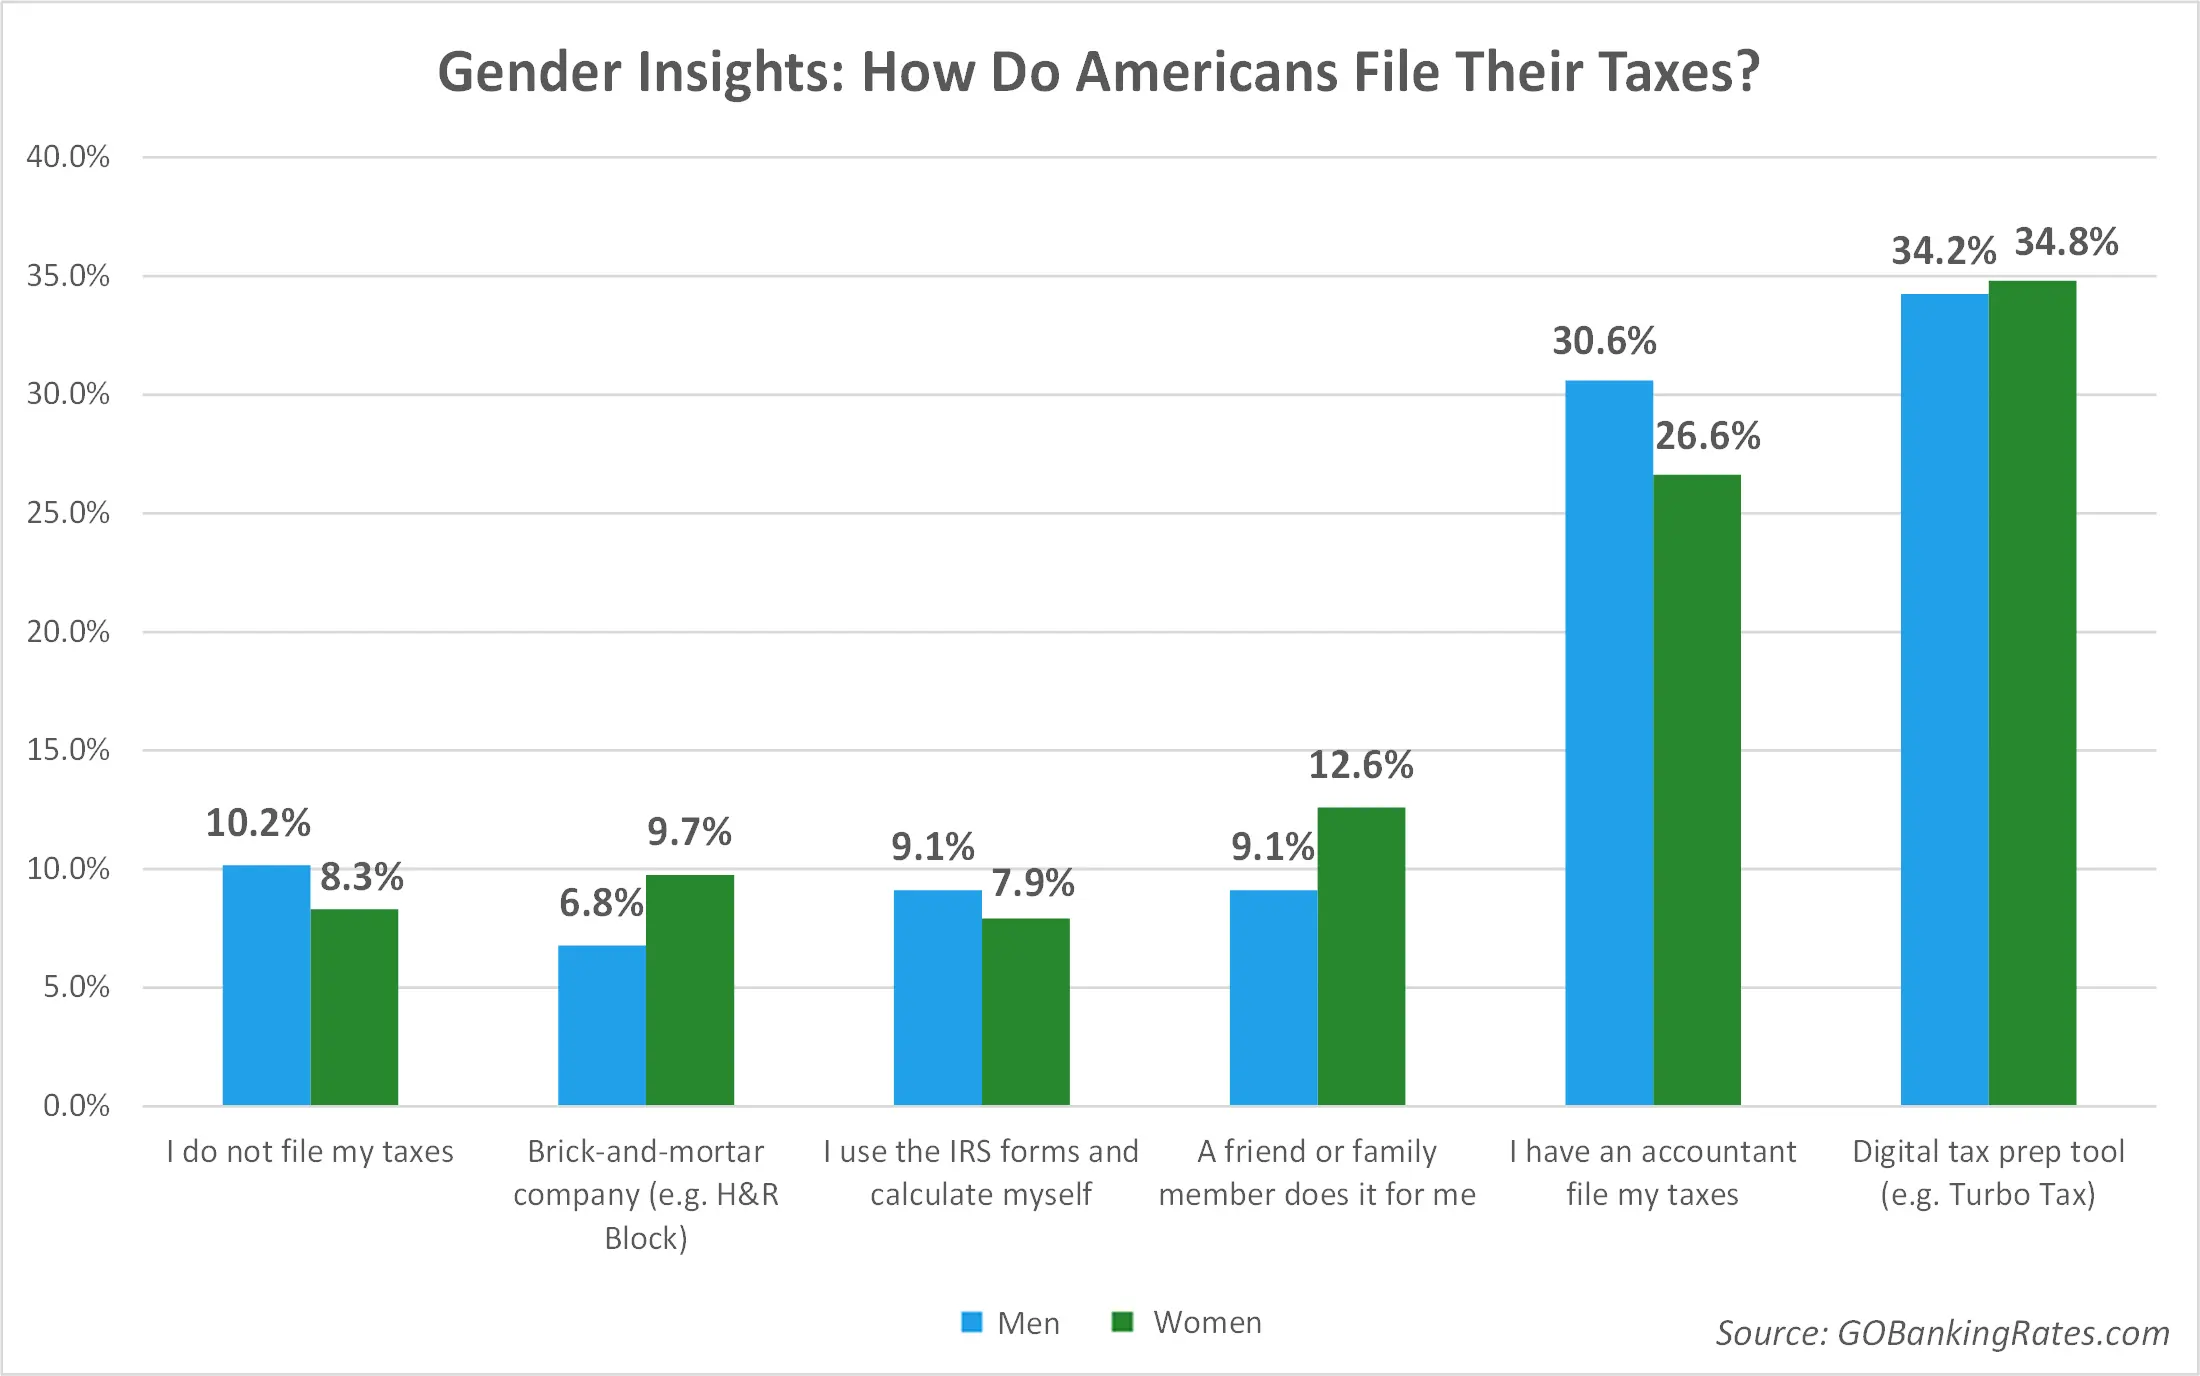
Women are more likely to prefer using a brick-and-mortar tax preparation service or to have a friend or family member file taxes for them, the survey found. Men, on the other hand, are more likely to file taxes by hand, hire an accountant to file for them or respond that they don’t file taxes. Men and women are about as likely to prefer filing taxes using a digital tax preparation tool or tax-filing software.
Keep Reading: 9 New or Improved Tax Breaks for 2016
Overall, this survey shows that Americans prefer a variety of methods to file taxes, and this preference often comes down to individuals’ financial situation and attitude about taxes. For many Americans, it makes the most sense to file their own taxes with the help of a tax preparation program. For others, it’s worth the higher cost to pass the headache of filing a return on to a professional. However you choose to file your 2015 tax return, just make sure you do it right and get it in by the 2016 tax deadline, which is April 18.
Methodology: GOBankingRates polled 5028 online users from Dec. 7-9, 2016 through Google Consumer Surveys on the prompt, “How do you file taxes?” Seven possible responses were offered with the option to select one: “digital tax prep tool (i.e. Turbo Tax),” “I have an accountant file my taxes,” “a friend or family member does it for me,” “I use the IRS forms and calculate myself,” “brick and mortar company (i.e. H&R Block),” and “I do not file my taxes,” displayed randomly, with “None of the above” displayed last. The survey represents the United State online population and has a margin of error of 1.7 percent. Some of the findings represented exclude “none of the above” responses, and analyses based on age and gender were performed only on responses for which the respondent’s relevant demographic information was available.


