After the Midterms, One Party Controls All the Wealthiest Congressional Districts
 Written by
Andrew DePietro
Written by
Andrew DePietro
 Edited by
Charlotte McMullen
Edited by
Charlotte McMullen

Commitment to Our Readers
GOBankingRates' editorial team is committed to bringing you unbiased reviews and information. We use data-driven methodologies to evaluate financial products and services - our reviews and ratings are not influenced by advertisers. You can read more about our editorial guidelines and our products and services review methodology.
20 Years
Helping You Live Richer
Reviewed
by Experts
Trusted by
Millions of Readers
- Democrats took control of the House of Representatives thanks to the 2018 midterm elections.
- Republicans have retained control of the Senate and picked up some seats.
- After the midterms, the top 10 wealthiest districts are represented by a single party.
Money and politics have become inseparable in America, with elections and campaigns more expensive than ever, especially in light of the 2018 midterm elections. Super PACs, although barred from coordinating with politicians directly, can help raise millions of dollars for a campaign and singlehandedly sway the outcome of an election.
GOBankingRates explored the connection between politics and money in a new analysis that determined the wealthiest congressional districts in the U.S. after the 2018 midterm election results came in. The report analyzed all 435 congressional districts in the nation, using income data sourced from the Census Bureau’s 2016 American Community Survey.
Although Florida has plenty of wealthy individuals, incomes in the state are quite low, overall. Low incomes bring down the median income of the population. Add on the manner in which congressional districts are drawn, and the result is that Florida is not among the wealthiest in the U.S.
Keep reading to find out where the richest congressional districts are in America — and which party represents them.
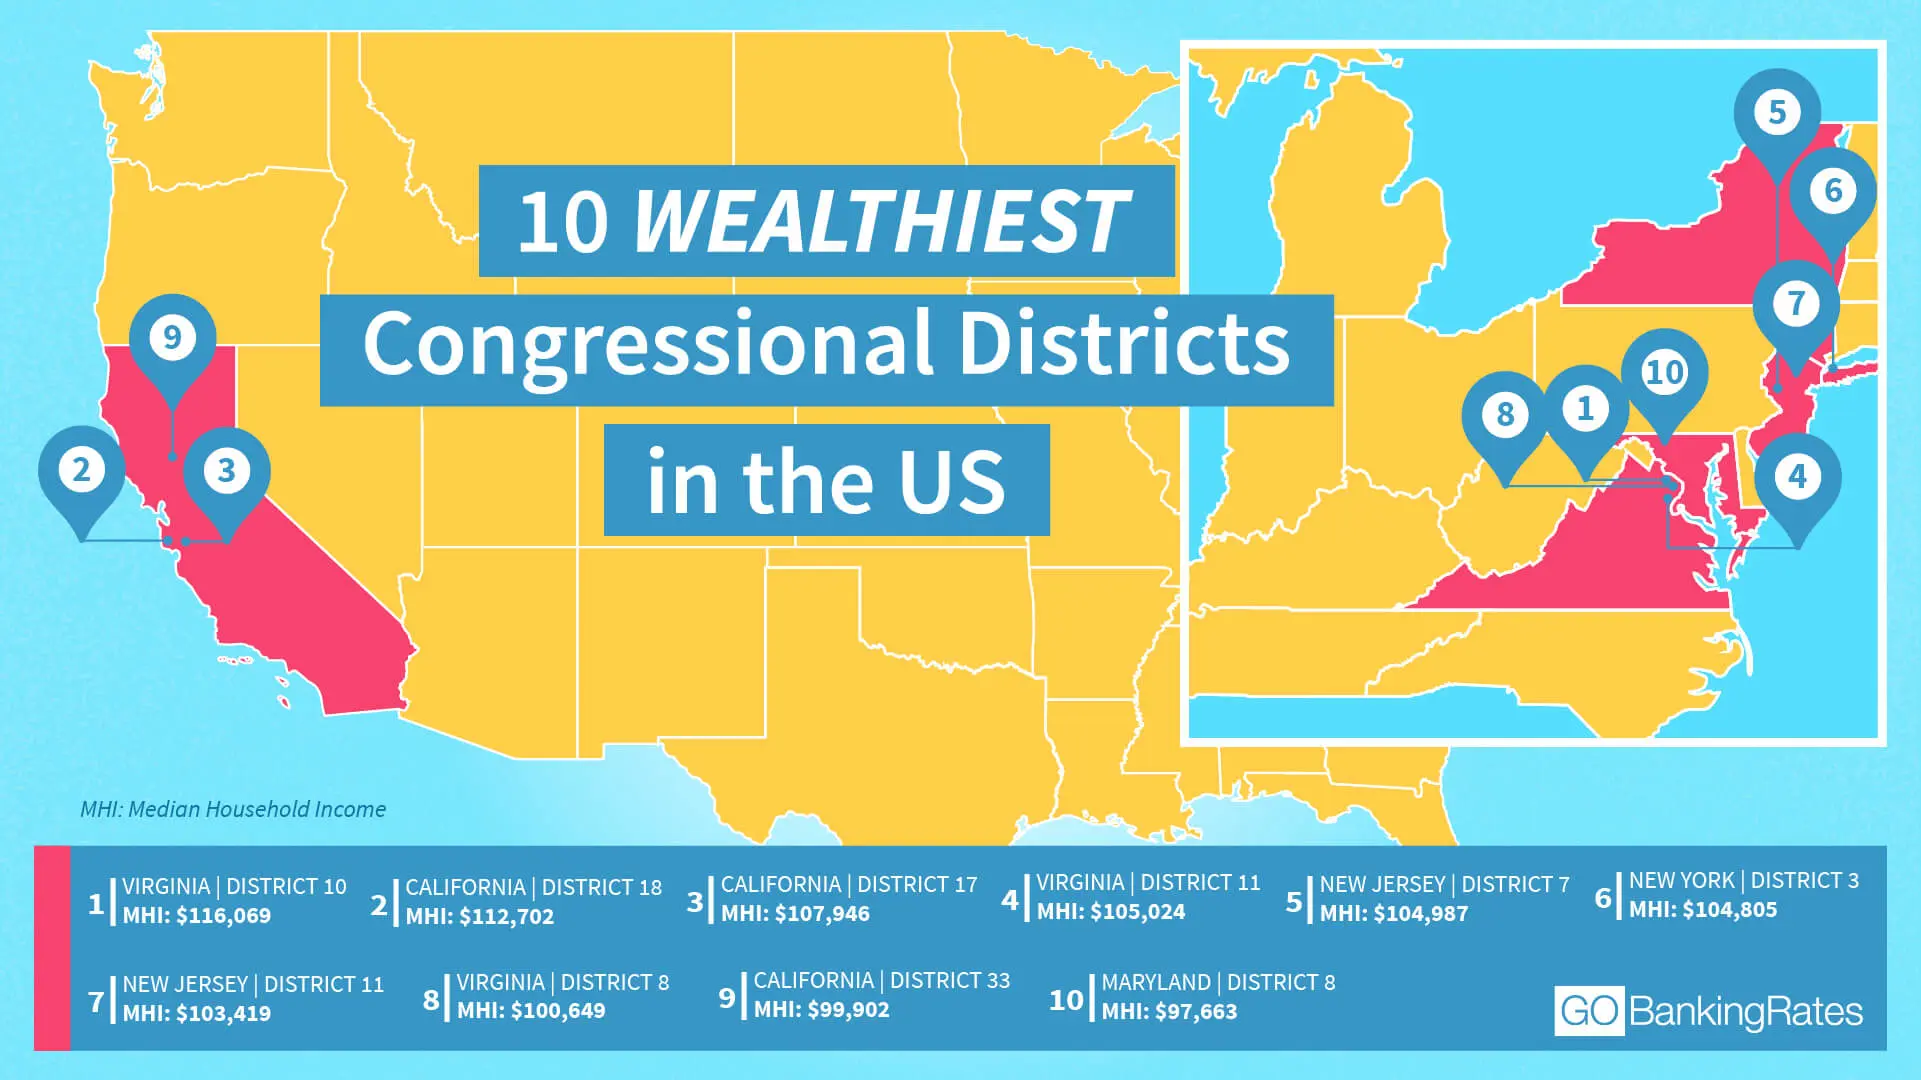
Top 10 Wealthiest Congressional Districts in the US
California, New Jersey, New York and Virginia dominated the top 10 wealthiest congressional districts. Out of the wealthiest 50 districts, 13 are located in California; eight are in New York; five in New Jersey; and four in Virginia. Massachusetts, which didn’t make the top 10, still sports four of the nation’s richest congressional districts.
Here are the 10 richest congressional districts in the U.S. by median household income:
- Congressional District 10, Virginia: $116,069 | Democrat
- Congressional District 18, California: $112,702 | Democrat
- Congressional District 17, California: $107,946 | Democrat
- Congressional District 11, Virginia: $105,024 | Democrat
- Congressional District 7, New Jersey: $104,987 | Democrat
- Congressional District 3, New York: $104,805 | Democrat
- Congressional District 11, New Jersey: $103,419 | Democrat
- Congressional District 8, Virginia: $100,649 | Democrat
- Congressional District 33, California: $99,902 | Democrat
- Congressional District 8, Maryland: $97,663 | Democrat
Virginia’s 10th Congressional District is the wealthiest in the country and will now be represented by the Democratic Party. This sprawling district in Northern Virginia is home to some towns well-known for their affluence. Great Falls boasts a median household income of $230,304, according to the Census Bureau. McLean isn’t too shabby, either, at $190,258. Newly elected Democrat Jennifer Wexton represents the district.
California’s 17th and 18th Districts can be found in the San Francisco Bay Area. The 17th District includes Cupertino, Fremont, Santa Clara, San Jose and Sunnyvale, places that are well-known for surging home values and tech industry wealth. The same goes for the 18th District, which covers Mountain View, Palo Alto, Redwood City and Santa Cruz. California’s 33rd District is in Southern California and stretches from Malibu in the northwest to Ranchos Palos Verdes in the southeast, covering all the wealthiest parts of Los Angeles.
Look: You’re Probably Richer Than These Members of Congress
List of the Richest Congressional Districts in the US
Among the top 10 richest congressional districts, Democrats now represent all 10. Out of the 50 richest districts, Democrats have 41 to Republicans’ nine.
Check out the 50 wealthiest congressional districts in the nation:
50 Wealthiest Congressional Districts in the US |
|||||||
| Wealth Ranking |
State | District | Median Household Income | Representative | Party | ||
| 1 | VA | 10th | $116,069 | Jennifer Wexton | Democrat | ||
| 2 | CA | 18th | $112,702 | Anna Eshoo | Democrat | ||
| 3 | CA | 17th | $107,946 | Ro Khanna | Democrat | ||
| 4 | VA | 11th | $105,024 | Gerald Connolly | Democrat | ||
| 5 | NJ | 7th | $104,987 | Tom Malinowski | Democrat | ||
| 6 | NY | 3rd | $104,805 | Thomas Suozzi | Democrat | ||
| 7 | NJ | 11th | $103,419 | Mikie Sherrill | Democrat | ||
| 8 | VA | 8th | $100,649 | Donald Beyer | Democrat | ||
| 9 | CA | 33rd | $99,902 | Ted Lieu | Democrat | ||
| 10 | MD | 8th | $97,663 | Jamie Raskin | Democrat | ||
| 11 | CA | 15th | $97,232 | Eric Swalwell | Democrat | ||
| 12 | NY | 4th | $96,078 | Kathleen Rice | Democrat | ||
| 13 | NJ | 5th | $95,701 | Josh Gottheimer | Democrat | ||
| 14 | CA | 45th | $93,995 | Mimi Walters | Republican | ||
| 15 | IL | 6th | $93,839 | Sean Casten | Democrat | ||
| 16 | CA | 14th | $93,666 | Jackie Speier | Democrat | ||
| 17 | NY | 12th | $93,559 | Carolyn Maloney | Democrat | ||
| 18 | MD | 5th | $92,295 | Steny Hoyer | Democrat | ||
| 19 | NY | 17th | $91,734 | Nita Lowey | Democrat | ||
| 20 | MA | 4th | $91,203 | Joseph Kennedy III | Democrat | ||
| 21 | NY | 2nd | $90,614 | Peter King | Republican | ||
| 22 | TX | 22nd | $90,194 | Pete Olson | Republican | ||
| 23 | CT | 4th | $90,142 | James Himes | Democrat | ||
| 24 | CA | 12th | $88,364 | Nancy Pelosi | Democrat | ||
| 25 | NY | 1st | $88,242 | Lee Zeldin | Republican | ||
| 26 | TX | 3rd | $86,783 | Van Taylor | Republican | ||
| 27 | IL | 14th | $86,449 | Lauren Underwood | Democrat | ||
| 28 | MA | 5th | $86,416 | Katherine Clark | Democrat | ||
| 29 | CA | 52nd | $86,174 | Scott Peters | Democrat | ||
| 30 | WA | 1st | $85,293 | Suzan DelBene | Democrat | ||
| 31 | CA | 19th | $85,010 | Zoe Lofgren | Democrat | ||
| 32 | CA | 48th | $83,894 | Harley Rouda | Democrat | ||
| 33 | PA | 7th | $82,483 | Susan Wild | Democrat | ||
| 34 | GA | 6th | $82,390 | Lucy McBath | Democrat | ||
| 35 | NY | 10th | $81,814 | Jerrold Nadler | Democrat | ||
| 36 | MN | 3rd | $81,804 | Dean Phillips | Democrat | ||
| 37 | MA | 6th | $81,711 | Seth Moulton | Democrat | ||
| 38 | TX | 26th | $81,425 | Michael Burgess | Republican | ||
| 39 | NJ | 12th | $81,115 | Bonnie Watson Coleman | Democrat | ||
| 40 | MD | 3rd | $81,032 | John Sarbanes | Democrat | ||
| 41 | CA | 39th | $80,844 | Young Kim | Republican | ||
| 42 | VA | 1st | $80,492 | Robert Wittman | Republican | ||
| 43 | PA | 8th | $79,615 | Matt Cartwright | Democrat | ||
| 44 | NY | 18th | $79,539 | Sean Maloney | Democrat | ||
| 45 | MA | 8th | $78,995 | Stephen Lynch | Democrat | ||
| 46 | CA | 11th | $78,487 | Mark DeSaulnier | Democrat | ||
| 47 | NJ | 4th | $77,685 | Christopher “Chris” Smith | Republican | ||
| 48 | PA | 6th | $77,580 | Chrissy Houlahan | Democrat | ||
| 49 | CA | 49th | $77,558 | Mike Levin (projected win) | Democrat | ||
| 50 | MN | 2nd | $77,468 | Angie Craig | Democrat | ||
Click through to read about the states that spend the most and least on welfare.
More on Money and Politics
- Take a Look at Rising Political Star Sen. Kamala Harris’ Finances
- How Cory Booker Became a Millionaire Through Politics and Investing
- Impeaching President Trump Would Cost Millions
- Watch: Trump vs Tech on Controversial Immigration Ban
We make money easy. Get weekly email updates, including expert advice to help you Live Richer™.
Methodology: The study analyzed every congressional district in all 50 states, determining the wealthiest congressional districts based on the highest median household income, sourced from the Census Bureau’s 2016 American Community Survey. The mean household income was included in our data for representational purposes. Information on representatives and political parties was sourced from GovTrack.


")


